Matplotlib 轴标签和标题
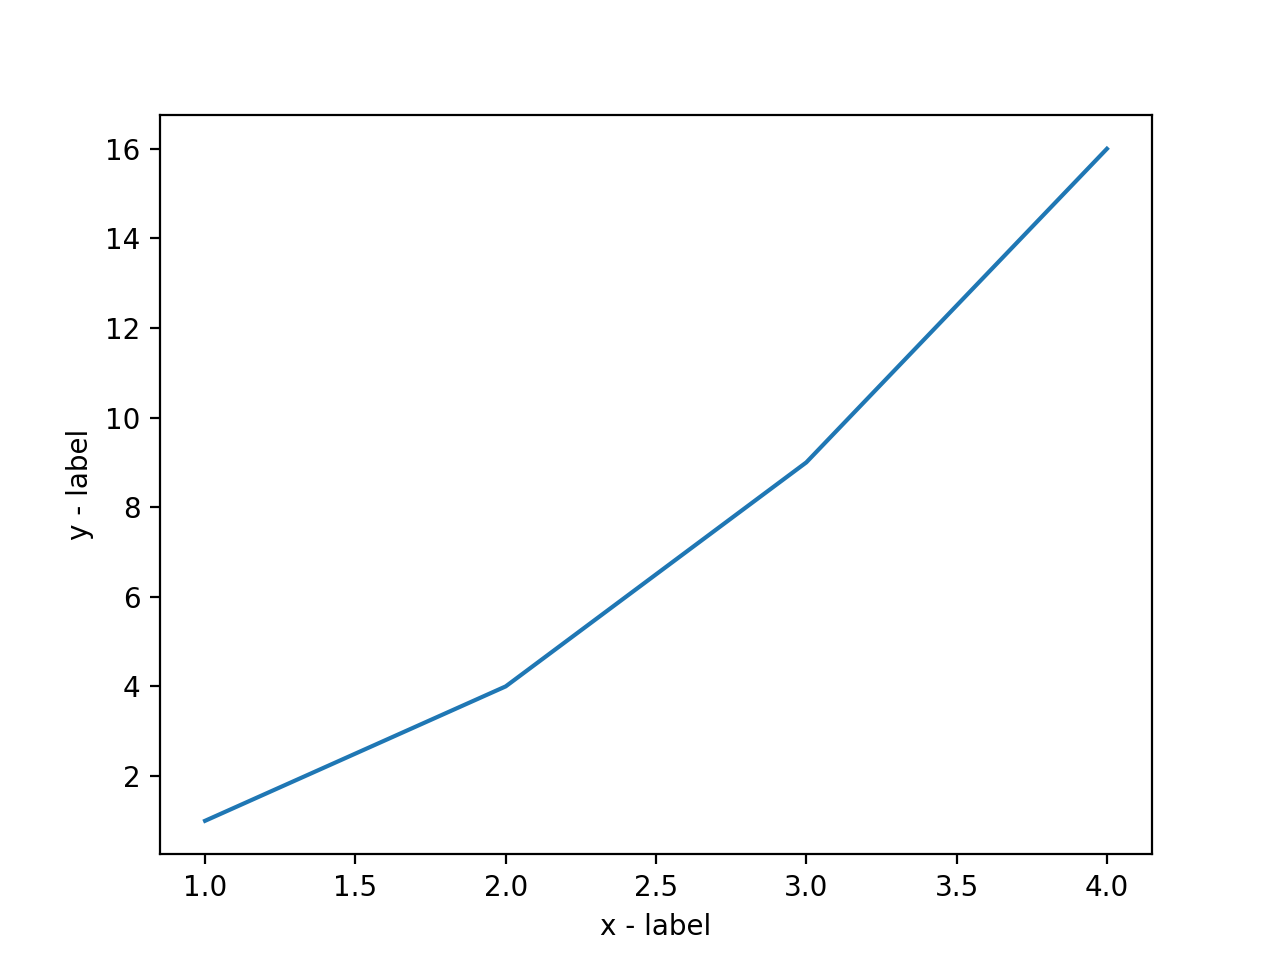
我们可以使用 xlabel() 和 ylabel() 方法来设置 x 轴和 y 轴的标签。
实例
import matplotlib. pyplot as plt
x = np. array ( [ 1 , 2 , 3 , 4 ] )
y = np. array ( [ 1 , 4 , 9 , 16 ] )
plt. plot ( x , y )
plt. xlabel ( "x - label" )
plt. ylabel ( "y - label" )
plt. show ( )
显示结果如下:
标题
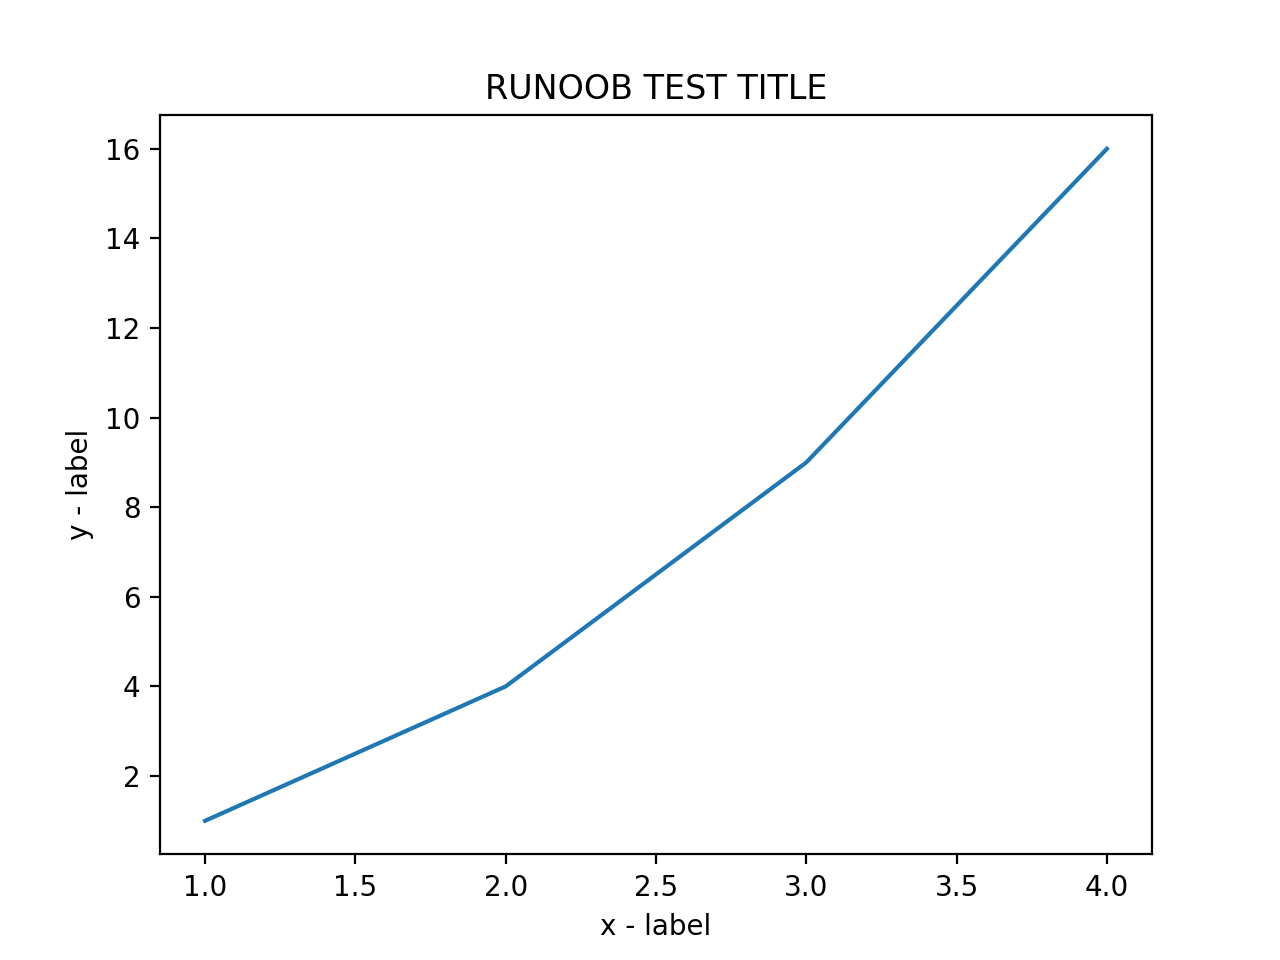
我们可以使用 title() 方法来设置标题。
实例
import matplotlib. pyplot as plt
x = np. array ( [ 1 , 2 , 3 , 4 ] )
y = np. array ( [ 1 , 4 , 9 , 16 ] )
plt. plot ( x , y )
plt. title ( "yssmx TEST TITLE" )
plt. xlabel ( "x - label" )
plt. ylabel ( "y - label" )
plt. show ( )
显示结果如下:
图形中文显示
Matplotlib 默认情况不支持中文,我们可以使用以下简单的方法来解决。
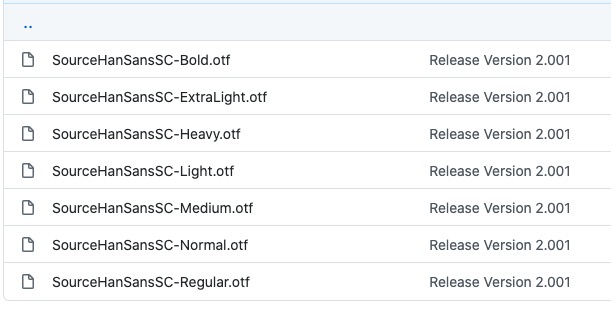
这里我们使用思源黑体,思源黑体是 Adobe 与 Google 推出的一款开源字体。
官网: https://source.typekit.com/source-han-serif/cn/
GitHub 地址: https://github.com/adobe-fonts/source-han-sans/tree/release/OTF/SimplifiedChinese
打开链接后,在里面选一个就好了:
你也可以在网盘下载: https://pan.baidu.com/s/10-w1JbXZSnx3Tm6uGpPGOw ,提取码: yxqu 。
可以下载个 OTF 字体,比如 SourceHanSansSC-Bold.otf,将该文件文件放在当前执行的代码文件中:
SourceHanSansSC-Bold.otf 文件放在当前执行的代码文件中:
实例
执行输出结果如下图:
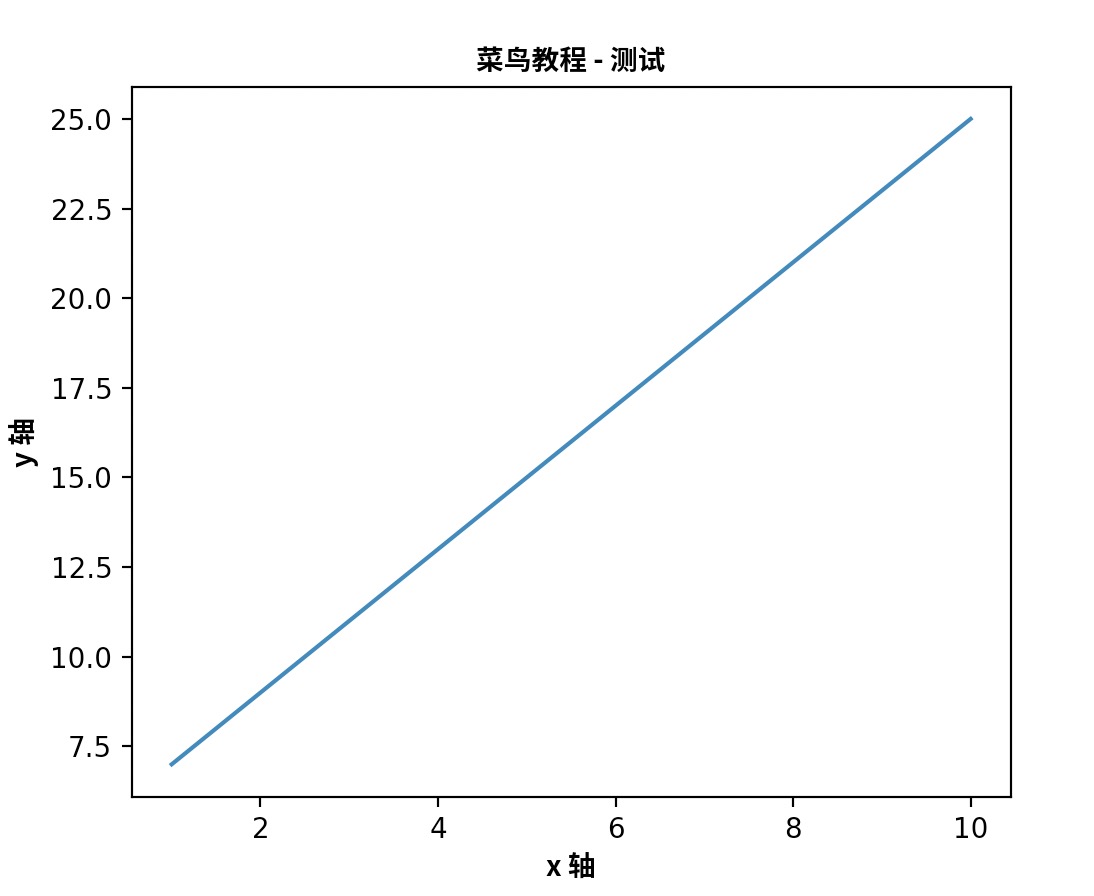
此外,我们还可以使用系统的字体:
										from matplotlib import pyplot as plt
import matplotlib
a=sorted([f.name for f in matplotlib.font_manager.fontManager.ttflist])
for i in a:
    print(i)
打印出你的 font_manager 的 ttflist 中所有注册的名字,找一个看中文字体例如:STFangsong(仿宋)、Heiti TC(黑体),然后添加以下代码即可:
plt.rcParams['font.family']=['STFangsong']
此外我们还可以自定义字体的样式:
实例
from matplotlib import pyplot as plt
import matplotlib
# fname 为 你下载的字体库路径,注意 SourceHanSansSC-Bold.otf 字体的路径,size 参数设置字体大小
zhfont1 = matplotlib. font_manager . FontProperties ( fname = "SourceHanSansSC-Bold.otf" , size = 18 )
font1 = { 'color' : 'blue' , 'size' : 20 }
font2 = { 'color' : 'darkred' , 'size' : 15 }
x = np. arange ( 1 , 11 )
y = 2 * x + 5
# fontdict 可以使用 css 来设置字体样式
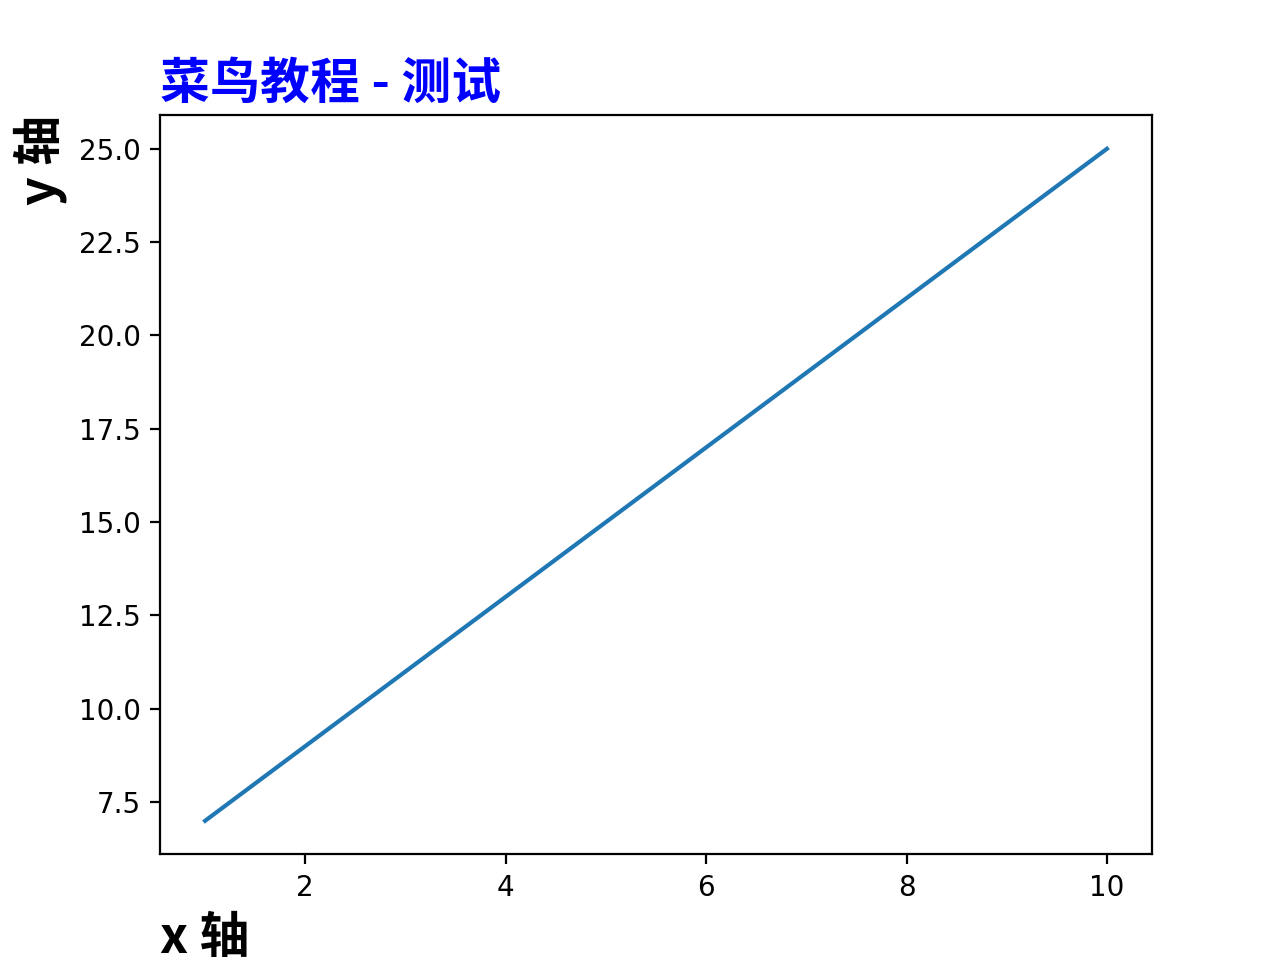
plt. title ( "云搜索MX教程 - 测试" , fontproperties = zhfont1 , fontdict = font1 )
# fontproperties 设置中文显示,fontsize 设置字体大小
plt. xlabel ( "x 轴" , fontproperties = zhfont1 )
plt. ylabel ( "y 轴" , fontproperties = zhfont1 )
plt. plot ( x , y )
plt. show ( )
输出结果如下:
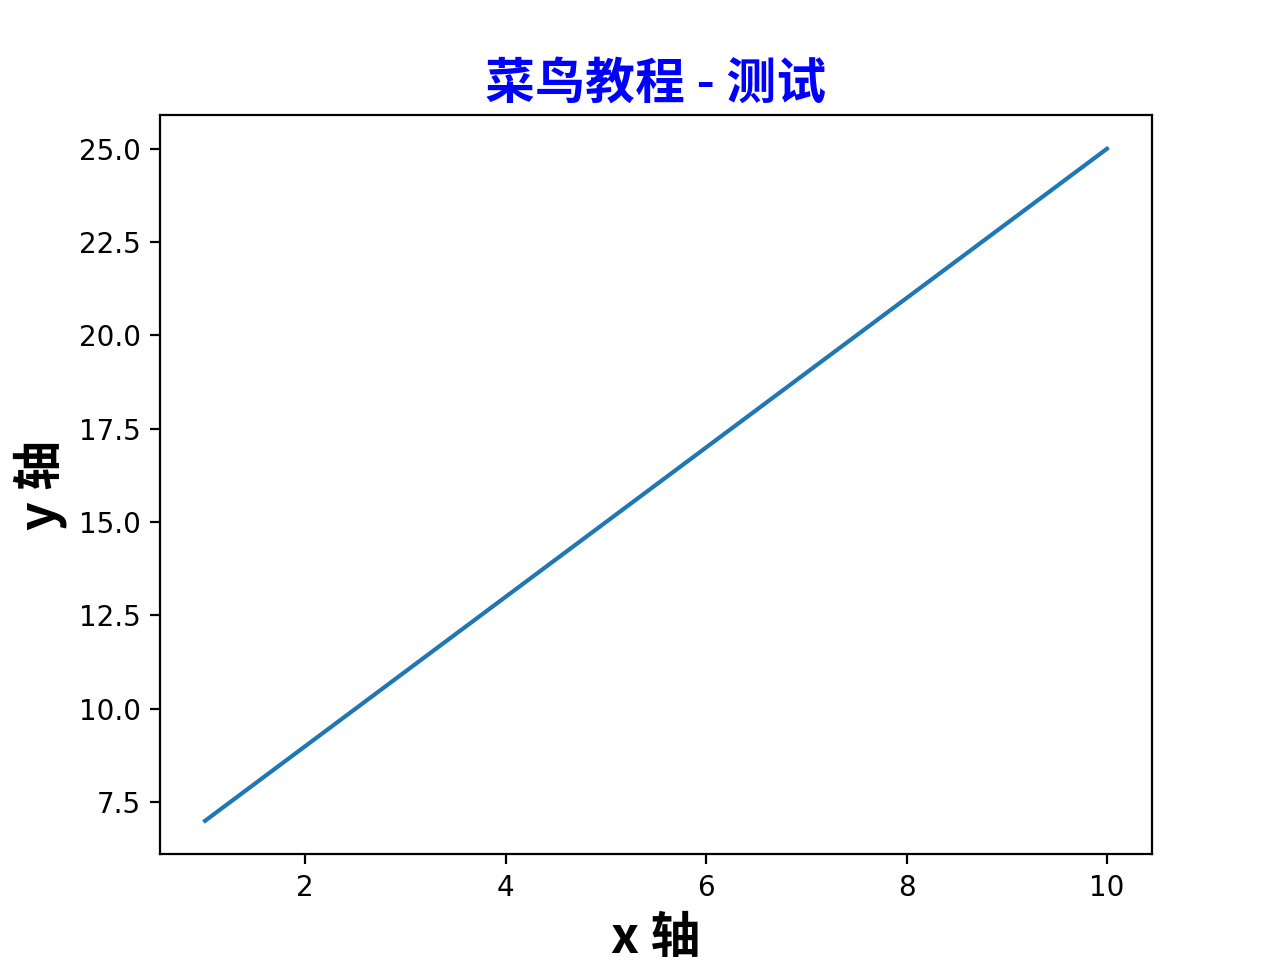
标题与标签的定位
title() 方法提供了 loc 参数来设置标题显示的位置,可以设置为: 'left', 'right', 和 'center', 默认值为 'center' 。
xlabel() 方法提供了 loc 参数来设置 x 轴显示的位置,可以设置为: 'left', 'right', 和 'center', 默认值为 'center' 。
ylabel() 方法提供了 loc 参数来设置 y 轴显示的位置,可以设置为: 'bottom', 'top', 和 'center', 默认值为 'center' 。
实例
from matplotlib import pyplot as plt
import matplotlib
# fname 为 你下载的字体库路径,注意 SourceHanSansSC-Bold.otf 字体的路径,size 参数设置字体大小
zhfont1 = matplotlib. font_manager . FontProperties ( fname = "SourceHanSansSC-Bold.otf" , size = 18 )
font1 = { 'color' : 'blue' , 'size' : 20 }
font2 = { 'color' : 'darkred' , 'size' : 15 }
x = np. arange ( 1 , 11 )
y = 2 * x + 5
# fontdict 可以使用 css 来设置字体样式
plt. title ( "云搜索MX教程 - 测试" , fontproperties = zhfont1 , fontdict = font1 , loc = "left" )
# fontproperties 设置中文显示,fontsize 设置字体大小
plt. xlabel ( "x 轴" , fontproperties = zhfont1 , loc = "left" )
plt. ylabel ( "y 轴" , fontproperties = zhfont1 , loc = "top" )
plt. plot ( x , y )
plt. show ( )
输出结果如下: