Matplotlib 散点图
我们可以使用 pyplot 中的 scatter() 方法来绘制散点图。
scatter() 方法语法格式如下:
matplotlib.pyplot.scatter(x, y, s=None, c=None, marker=None, cmap=None, norm=None, vmin=None, vmax=None, alpha=None, linewidths=None, *, edgecolors=None, plotnonfinite=False, data=None, **kwargs)
参数说明:
x,y :长度相同的数组,也就是我们即将绘制散点图的数据点,输入数据。
s :点的大小,默认 20,也可以是个数组,数组每个参数为对应点的大小。
c :点的颜色,默认蓝色 'b',也可以是个 RGB 或 RGBA 二维行数组。
marker :点的样式,默认小圆圈 'o'。
cmap :Colormap,默认 None,标量或者是一个 colormap 的名字,只有 c 是一个浮点数数组的时才使用。如果没有申明就是 image.cmap。
norm :Normalize,默认 None,数据亮度在 0-1 之间,只有 c 是一个浮点数的数组的时才使用。
vmin,vmax: :亮度设置,在 norm 参数存在时会忽略。
alpha: :透明度设置,0-1 之间,默认 None,即不透明。
linewidths: :标记点的长度。
edgecolors: :颜色或颜色序列,默认为 'face',可选值有 'face', 'none', None。
plotnonfinite: :布尔值,设置是否使用非限定的 c ( inf, -inf 或 nan) 绘制点。
**kwargs: :其他参数。
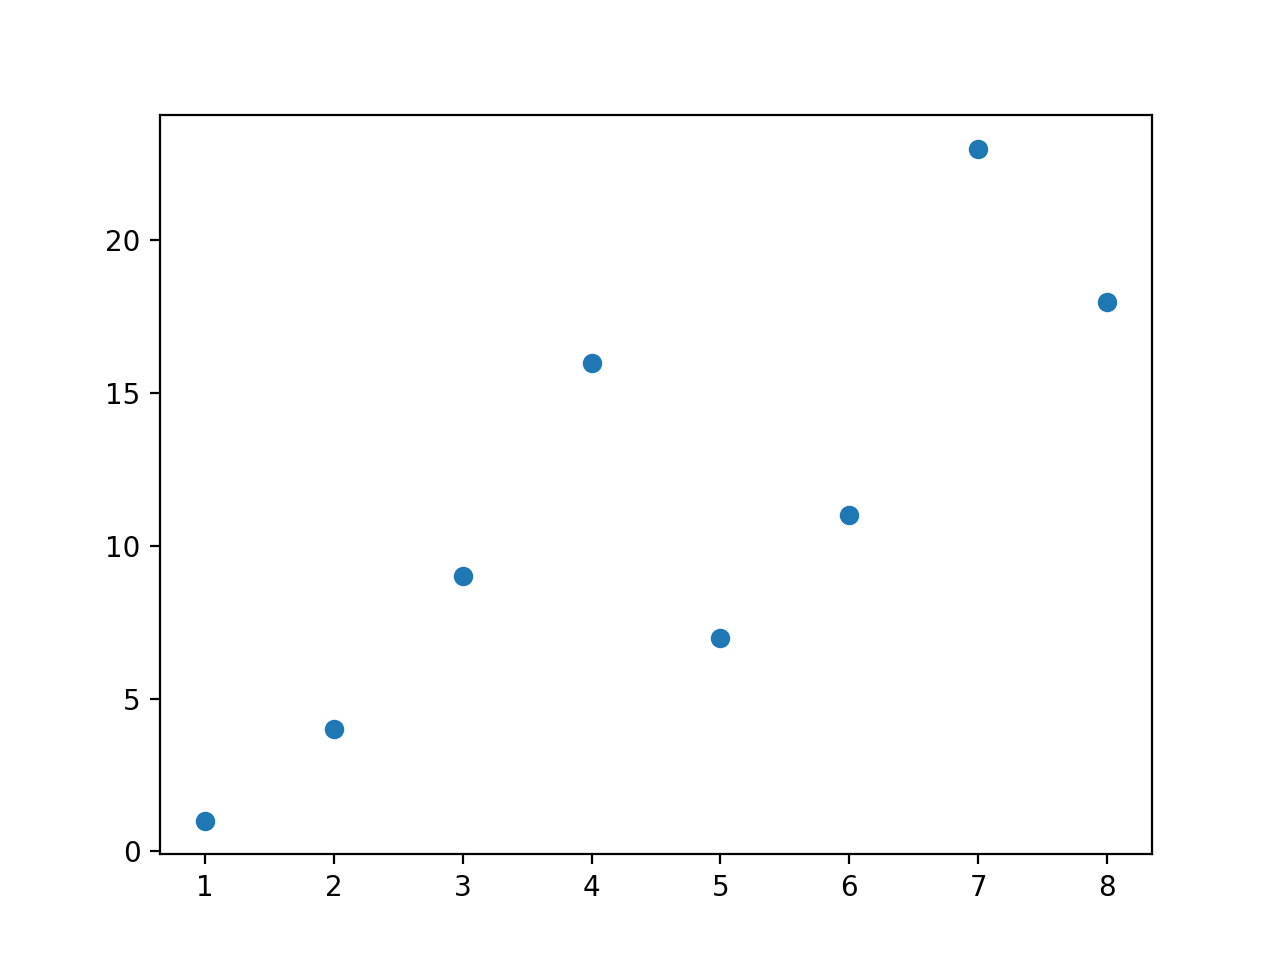
以下实例 scatter() 函数接收长度相同的数组参数,一个用于 x 轴的值,另一个用于 y 轴上的值:
实例
import numpy as np
x = np. array ( [ 1 , 2 , 3 , 4 , 5 , 6 , 7 , 8 ] )
y = np. array ( [ 1 , 4 , 9 , 16 , 7 , 11 , 23 , 18 ] )
plt. scatter ( x , y )
plt. show ( )
显示结果如下:
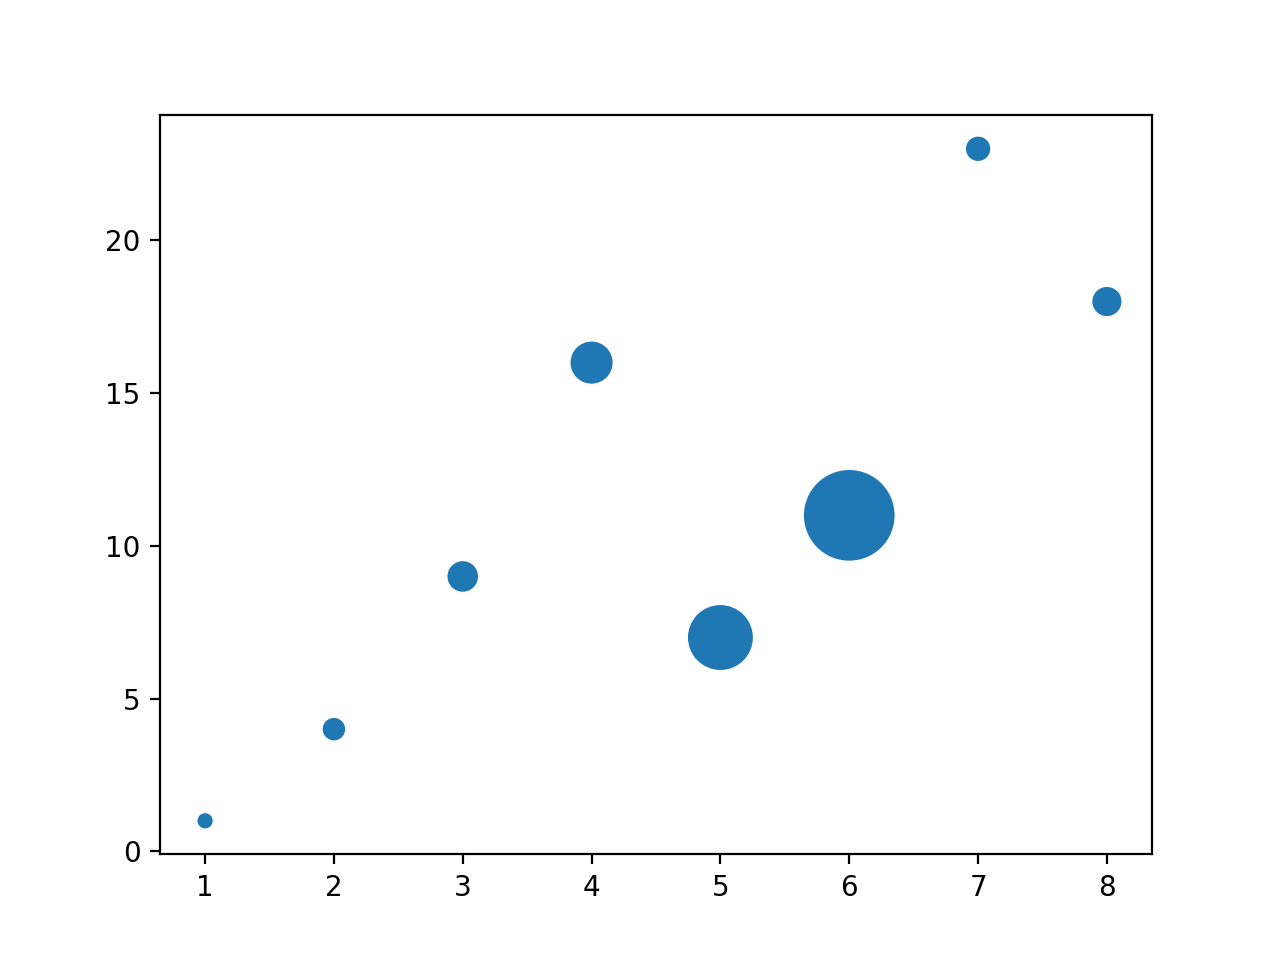
设置图标大小:
实例
import numpy as np
x = np. array ( [ 1 , 2 , 3 , 4 , 5 , 6 , 7 , 8 ] )
y = np. array ( [ 1 , 4 , 9 , 16 , 7 , 11 , 23 , 18 ] )
sizes = np. array ( [ 20 , 50 , 100 , 200 , 500 , 1000 , 60 , 90 ] )
plt. scatter ( x , y , s = sizes )
plt. show ( )
显示结果如下:
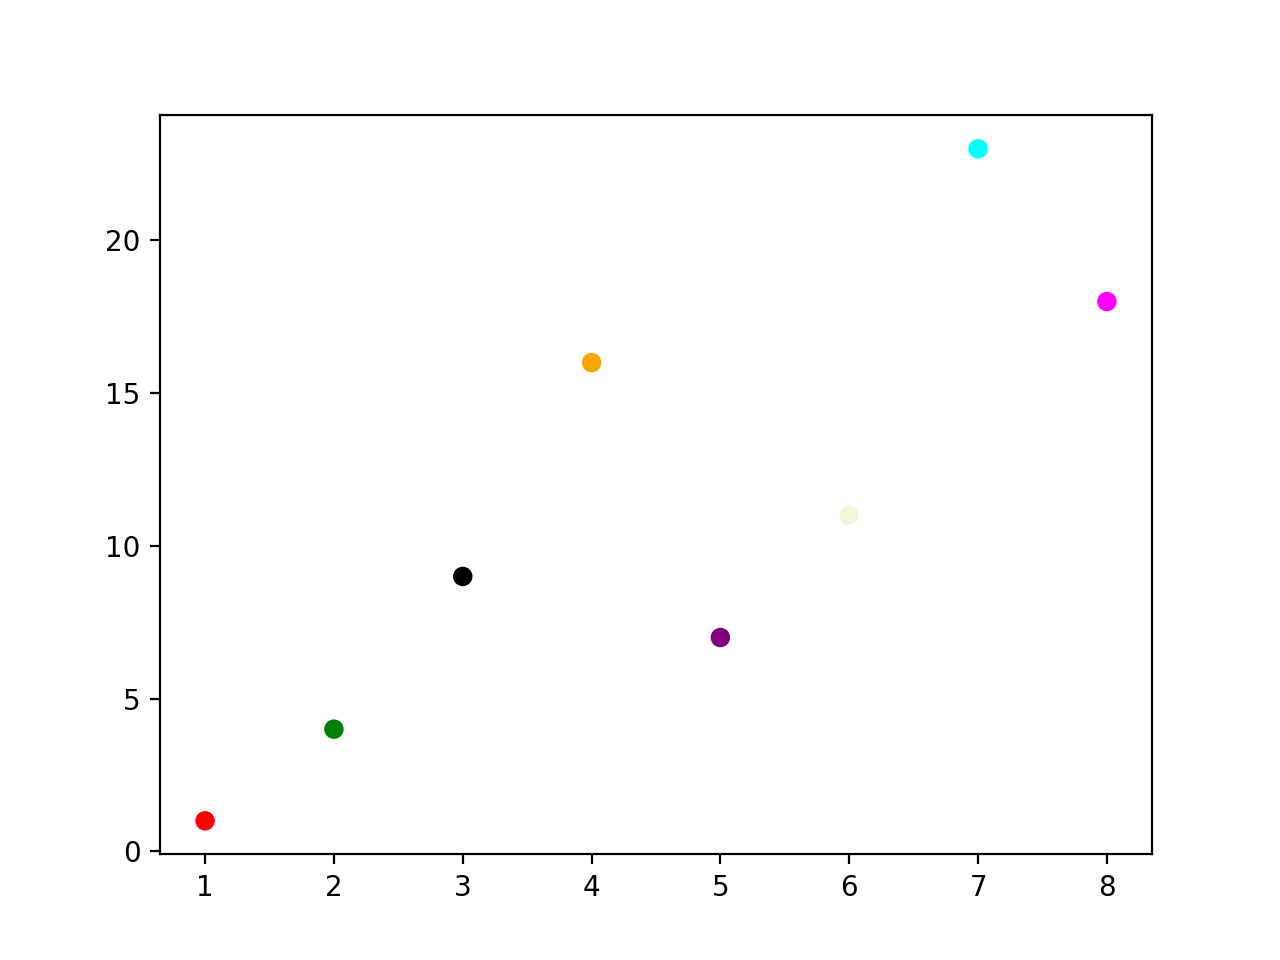
自定义点的颜色:
实例
import numpy as np
x = np. array ( [ 1 , 2 , 3 , 4 , 5 , 6 , 7 , 8 ] )
y = np. array ( [ 1 , 4 , 9 , 16 , 7 , 11 , 23 , 18 ] )
colors = np. array ( [ "red" , "green" , "black" , "orange" , "purple" , "beige" , "cyan" , "magenta" ] )
plt. scatter ( x , y , c = colors )
plt. show ( )
显示结果如下:
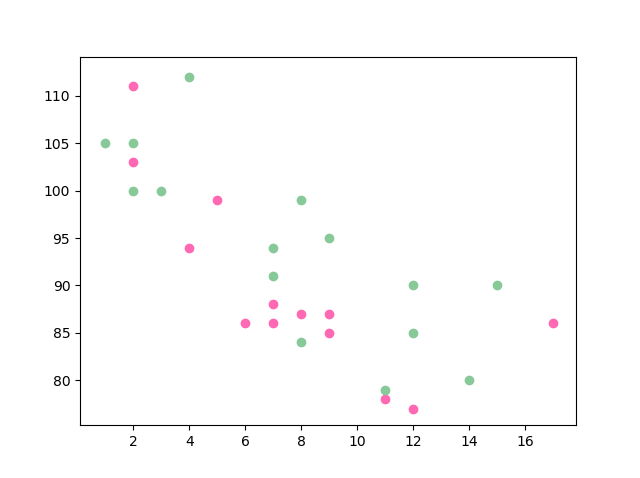
设置两组散点图:
实例
import numpy as np
x = np. array ( [ 5 , 7 , 8 , 7 , 2 , 17 , 2 , 9 , 4 , 11 , 12 , 9 , 6 ] )
y = np. array ( [ 99 , 86 , 87 , 88 , 111 , 86 , 103 , 87 , 94 , 78 , 77 , 85 , 86 ] )
plt. scatter ( x , y , color = 'hotpink' )
x = np. array ( [ 2 , 2 , 8 , 1 , 15 , 8 , 12 , 9 , 7 , 3 , 11 , 4 , 7 , 14 , 12 ] )
y = np. array ( [ 100 , 105 , 84 , 105 , 90 , 99 , 90 , 95 , 94 , 100 , 79 , 112 , 91 , 80 , 85 ] )
plt. scatter ( x , y , color = '#88c999' )
plt. show ( )
显示结果如下:
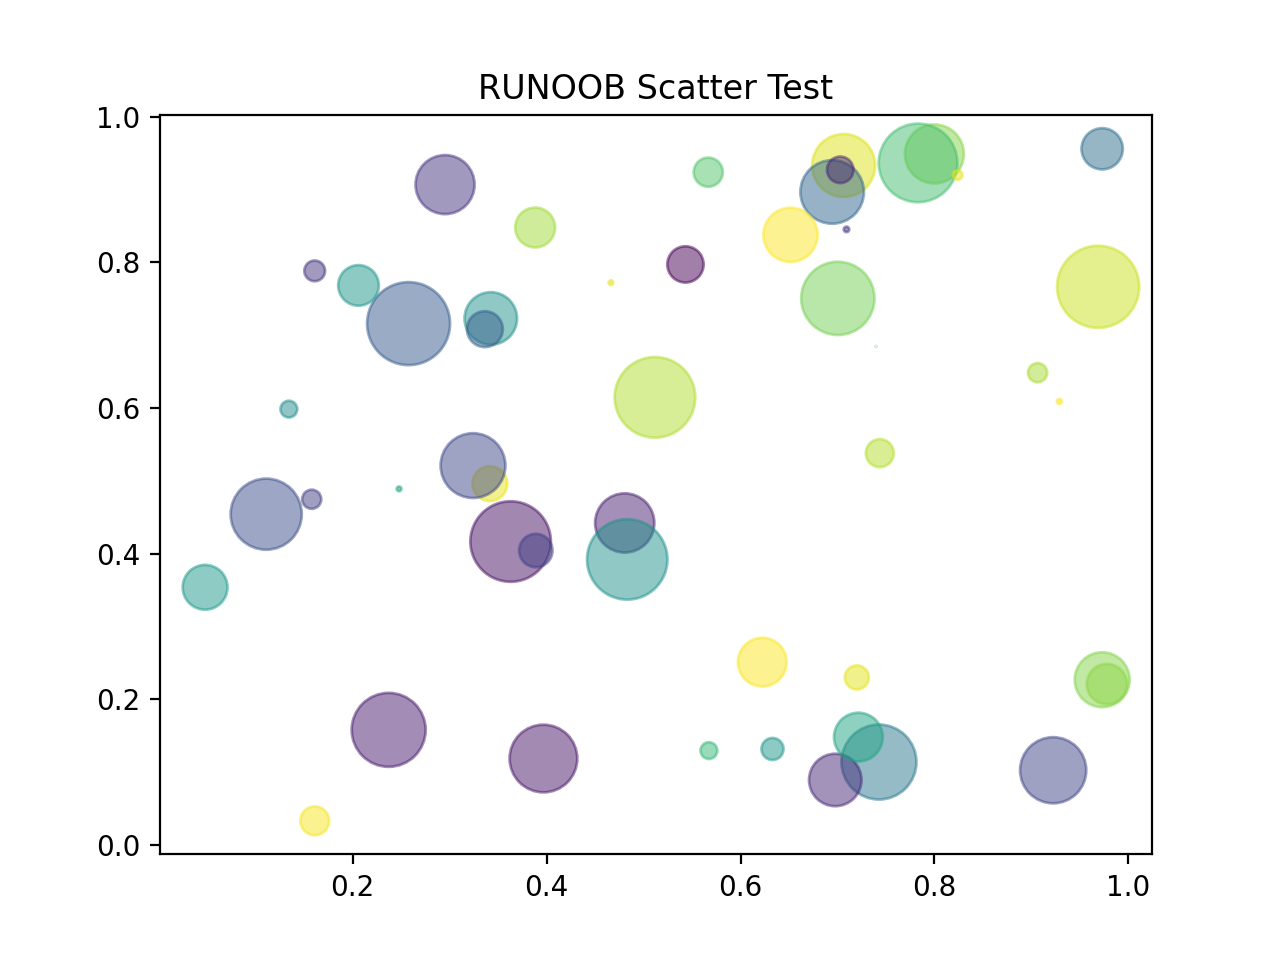
使用随机数来设置散点图:
实例
import matplotlib. pyplot as plt
# 随机数生成器的种子
np. random . seed ( 19680801 )
N = 50
x = np. random . rand ( N )
y = np. random . rand ( N )
colors = np. random . rand ( N )
area = ( 30 * np. random . rand ( N ) ) ** 2 # 0 to 15 point radii
plt. scatter ( x , y , s = area , c = colors , alpha = 0.5 ) # 设置颜色及透明度
plt. title ( "yssmx Scatter Test" ) # 设置标题
plt. show ( )
显示结果如下:
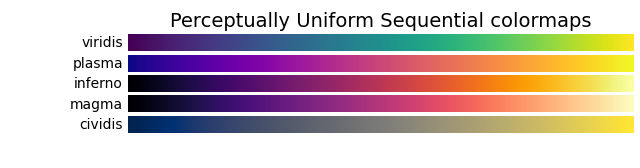
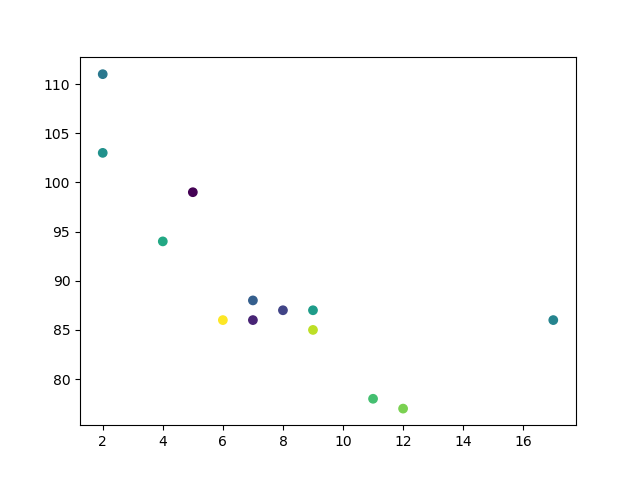
颜色条 Colormap
Matplotlib 模块提供了很多可用的颜色条。
颜色条就像一个颜色列表,其中每种颜色都有一个范围从 0 到 100 的值。
下面是一个颜色条的例子:

设置颜色条需要使用 cmap 参数,默认值为 'viridis',之后颜色值设置为 0 到 100 的数组。
实例
import numpy as np
x = np. array ( [ 5 , 7 , 8 , 7 , 2 , 17 , 2 , 9 , 4 , 11 , 12 , 9 , 6 ] )
y = np. array ( [ 99 , 86 , 87 , 88 , 111 , 86 , 103 , 87 , 94 , 78 , 77 , 85 , 86 ] )
colors = np. array ( [ , 10 , 20 , 30 , 40 , 45 , 50 , 55 , 60 , 70 , 80 , 90 , 100 ] )
plt. scatter ( x , y , c = colors , cmap = 'viridis' )
plt. show ( )
显示结果如下:
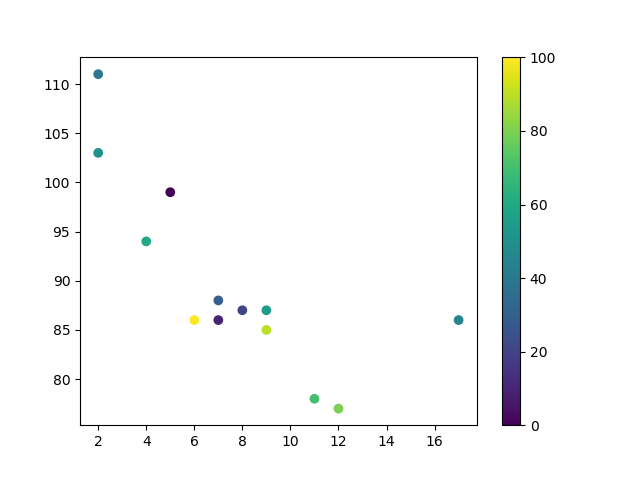
如果要显示颜色条,需要使用 plt.colorbar() 方法:
实例
import numpy as np
x = np. array ( [ 5 , 7 , 8 , 7 , 2 , 17 , 2 , 9 , 4 , 11 , 12 , 9 , 6 ] )
y = np. array ( [ 99 , 86 , 87 , 88 , 111 , 86 , 103 , 87 , 94 , 78 , 77 , 85 , 86 ] )
colors = np. array ( [ , 10 , 20 , 30 , 40 , 45 , 50 , 55 , 60 , 70 , 80 , 90 , 100 ] )
plt. scatter ( x , y , c = colors , cmap = 'viridis' )
plt. colorbar ( )
plt. show ( )
显示结果如下:
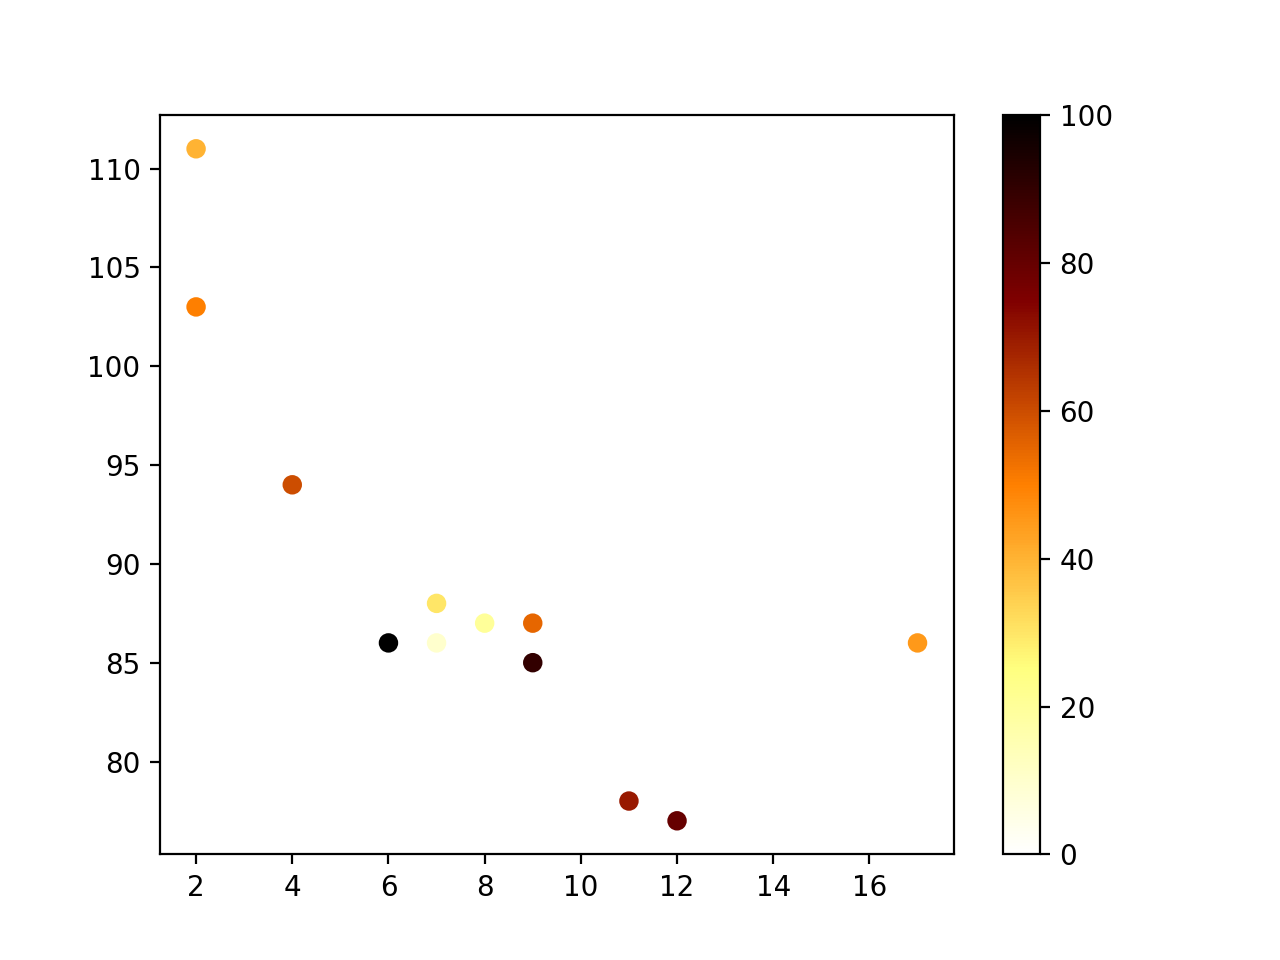
换个颜色条参数, cmap 设置为 afmhot_r :
实例
import numpy as np
x = np. array ( [ 5 , 7 , 8 , 7 , 2 , 17 , 2 , 9 , 4 , 11 , 12 , 9 , 6 ] )
y = np. array ( [ 99 , 86 , 87 , 88 , 111 , 86 , 103 , 87 , 94 , 78 , 77 , 85 , 86 ] )
colors = np. array ( [ , 10 , 20 , 30 , 40 , 45 , 50 , 55 , 60 , 70 , 80 , 90 , 100 ] )
plt. scatter ( x , y , c = colors , cmap = 'afmhot_r' )
plt. colorbar ( )
plt. show ( )
显示结果如下:
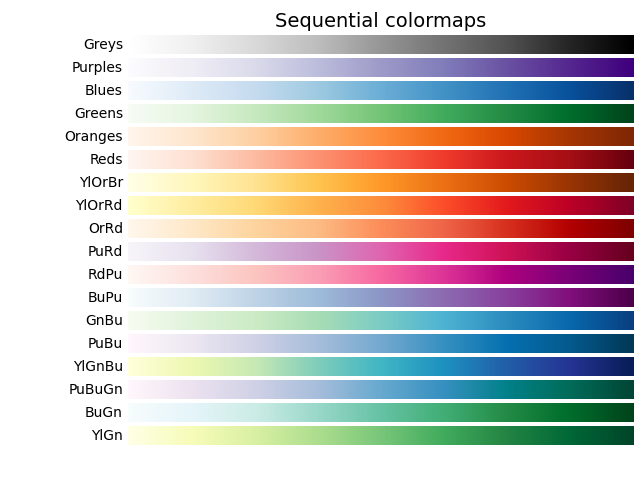
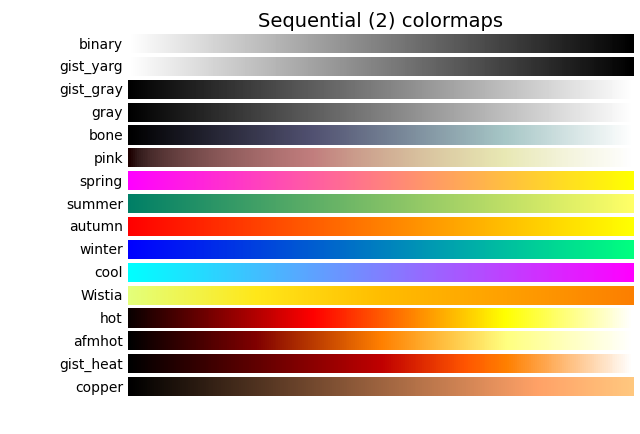
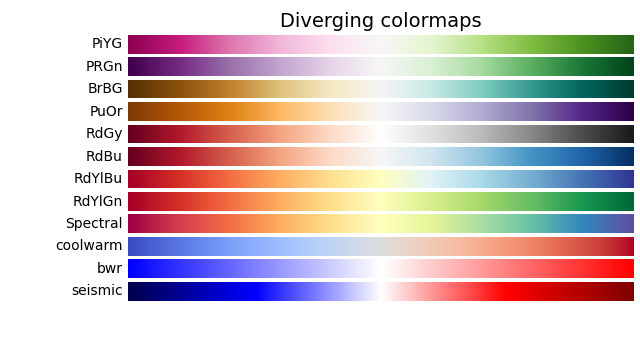
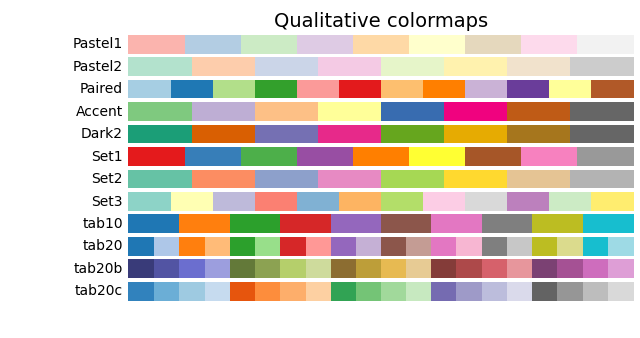
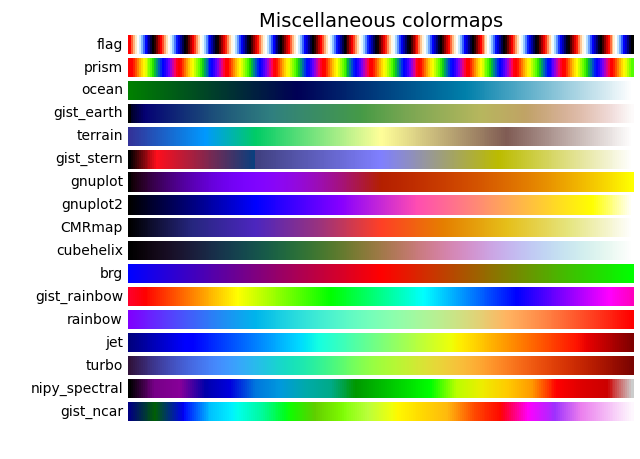
颜色条参数值可以是以下值:
| 颜色名称 | 保留关键字 | |
|---|---|---|
| Accent | Accent_r | |
| Blues | Blues_r | |
| BrBG | BrBG_r | |
| BuGn | BuGn_r | |
| BuPu | BuPu_r | |
| CMRmap | CMRmap_r | |
| Dark2 | Dark2_r | |
| GnBu | GnBu_r | |
| Greens | Greens_r | |
| Greys | Greys_r | |
| OrRd | OrRd_r | |
| Oranges | Oranges_r | |
| PRGn | PRGn_r | |
| Paired | Paired_r | |
| Pastel1 | Pastel1_r | |
| Pastel2 | Pastel2_r | |
| PiYG | PiYG_r | |
| PuBu | PuBu_r | |
| PuBuGn | PuBuGn_r | |
| PuOr | PuOr_r | |
| PuRd | PuRd_r | |
| Purples | Purples_r | |
| RdBu | RdBu_r | |
| RdGy | RdGy_r | |
| RdPu | RdPu_r | |
| RdYlBu | RdYlBu_r | |
| RdYlGn | RdYlGn_r | |
| Reds | Reds_r | |
| Set1 | Set1_r | |
| Set2 | Set2_r | |
| Set3 | Set3_r | |
| Spectral | Spectral_r | |
| Wistia | Wistia_r | |
| YlGn | YlGn_r | |
| YlGnBu | YlGnBu_r | |
| YlOrBr | YlOrBr_r | |
| YlOrRd | YlOrRd_r | |
| afmhot | afmhot_r | |
| autumn | autumn_r | |
| binary | binary_r | |
| bone | bone_r | |
| brg | brg_r | |
| bwr | bwr_r | |
| cividis | cividis_r | |
| cool | cool_r | |
| coolwarm | coolwarm_r | |
| copper | copper_r | |
| cubehelix | cubehelix_r | |
| flag | flag_r | |
| gist_earth | gist_earth_r | |
| gist_gray | gist_gray_r | |
| gist_heat | gist_heat_r | |
| gist_ncar | gist_ncar_r | |
| gist_rainbow | gist_rainbow_r | |
| gist_stern | gist_stern_r | |
| gist_yarg | gist_yarg_r | |
| gnuplot | gnuplot_r | |
| gnuplot2 | gnuplot2_r | |
| gray | gray_r | |
| hot | hot_r | |
| hsv | hsv_r | |
| inferno | inferno_r | |
| jet | jet_r | |
| magma | magma_r | |
| nipy_spectral | nipy_spectral_r | |
| ocean | ocean_r | |
| pink | pink_r | |
| plasma | plasma_r | |
| prism | prism_r | |
| rainbow | rainbow_r | |
| seismic | seismic_r | |
| spring | spring_r | |
| summer | summer_r | |
| tab10 | tab10_r | |
| tab20 | tab20_r | |
| tab20b | tab20b_r | |
| tab20c | tab20c_r | |
| terrain | terrain_r | |
| twilight | twilight_r | |
| twilight_shifted | twilight_shifted_r | |
| viridis | viridis_r | |
| winter | winter_r |