Matplotlib Pyplot
Pyplot 是 Matplotlib 的子库,提供了和 MATLAB 类似的绘图 API。
Pyplot 是常用的绘图模块,能很方便让用户绘制 2D 图表。
Pyplot 包含一系列绘图函数的相关函数,每个函数会对当前的图像进行一些修改,例如:给图像加上标记,生新的图像,在图像中产生新的绘图区域等等。
使用的时候,我们可以使用 import 导入 pyplot 库,并设置一个别名 plt :
这样我们就可以使用 plt 来引用 Pyplot 包的方法。
以下是一些常用的 pyplot 函数:
-
plot():用于绘制线图和散点图 -
scatter():用于绘制散点图 -
bar():用于绘制垂直条形图和水平条形图 -
hist():用于绘制直方图 -
pie():用于绘制饼图 -
imshow():用于绘制图像 -
subplots():用于创建子图
除了这些基本的函数,pyplot 还提供了很多其他的函数,例如用于设置图表属性的函数、用于添加文本和注释的函数、用于保存图表到文件的函数等等。
以下实例,我们通过两个坐标 (0,0) 到 (6,100) 来绘制一条线:
实例
import numpy as np
xpoints = np. array ( [ , 6 ] )
ypoints = np. array ( [ , 100 ] )
plt. plot ( xpoints , ypoints )
plt. show ( )
输出结果如下所示:
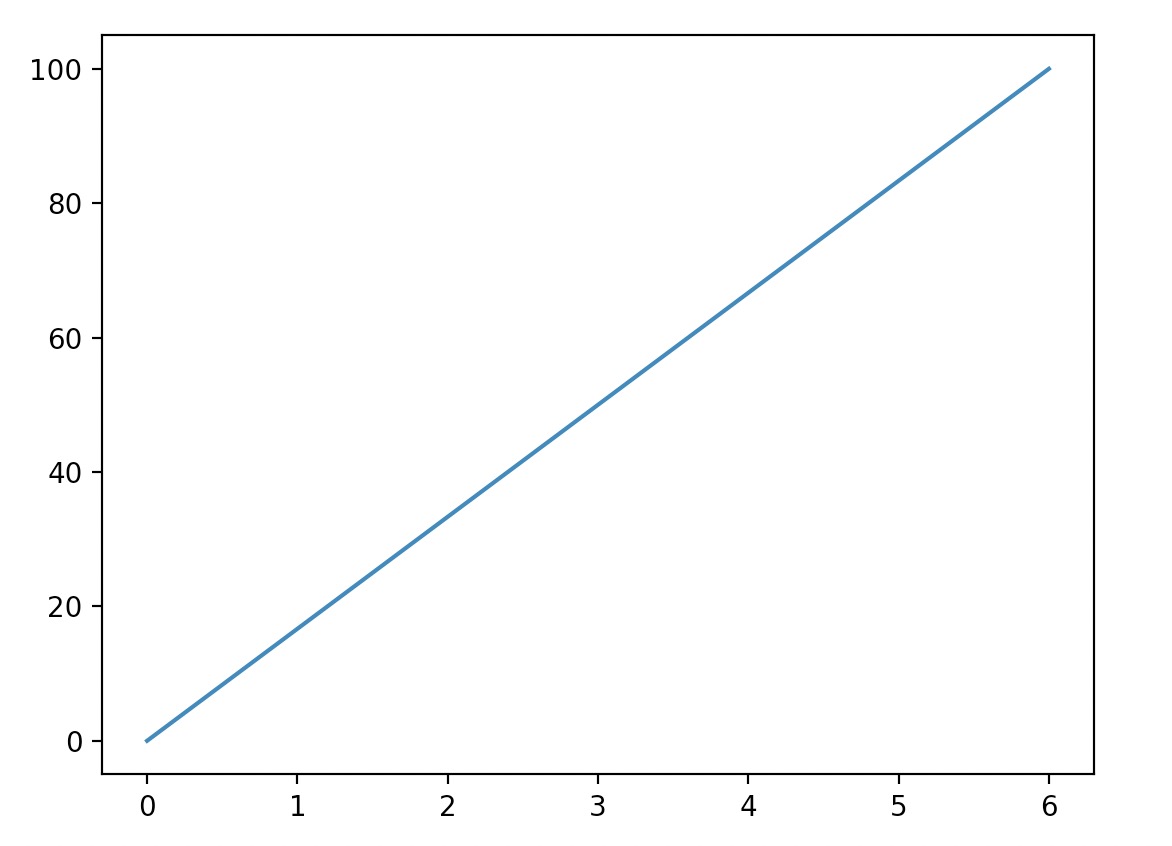
以上实例中我们使用了 Pyplot 的 plot() 函数, plot() 函数是绘制二维图形的最基本函数。
plot() 用于画图它可以绘制点和线,语法格式如下:
		# 画单条线
plot([x], y, [fmt], *, data=None, **kwargs)
# 画多条线
plot([x], y, [fmt], [x2], y2, [fmt2], ..., **kwargs)
参数说明:
- x, y: 点或线的节点,x 为 x 轴数据,y 为 y 轴数据,数据可以列表或数组。
- fmt: 可选,定义基本格式(如颜色、标记和线条样式)。
- **kwargs: 可选,用在二维平面图上,设置指定属性,如标签,线的宽度等。
>>> plot ( x , y , 'bo' ) # 创建 y 中数据与 x 中对应值的二维线图,使用蓝色实心圈绘制
>>> plot ( y ) # x 的值为 0..N-1
>>> plot ( y , 'r+' ) # 使用红色 + 号
颜色字符: 'b' 蓝色,'m' 洋红色,'g' 绿色,'y' 黄色,'r' 红色,'k' 黑色,'w' 白色,'c' 青绿色,'#008000' RGB 颜色符串。多条曲线不指定颜色时,会自动选择不同颜色。
线型参数: '‐' 实线,'‐‐' 破折线,'‐.' 点划线,':' 虚线。
标记字符: '.' 点标记,',' 像素标记(极小点),'o' 实心圈标记,'v' 倒三角标记,'^' 上三角标记,'>' 右三角标记,'<' 左三角标记...等等。
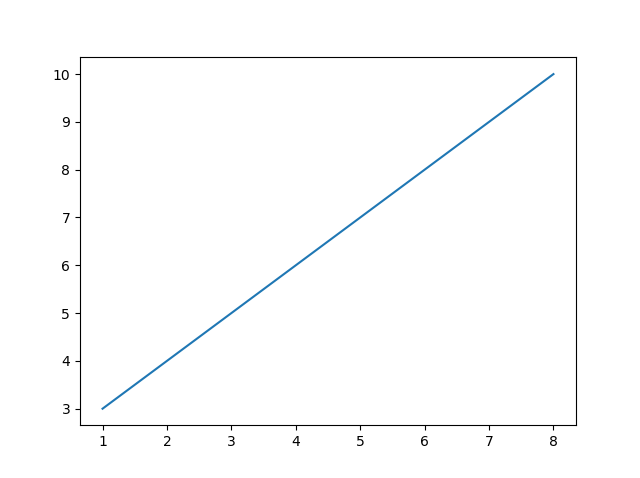
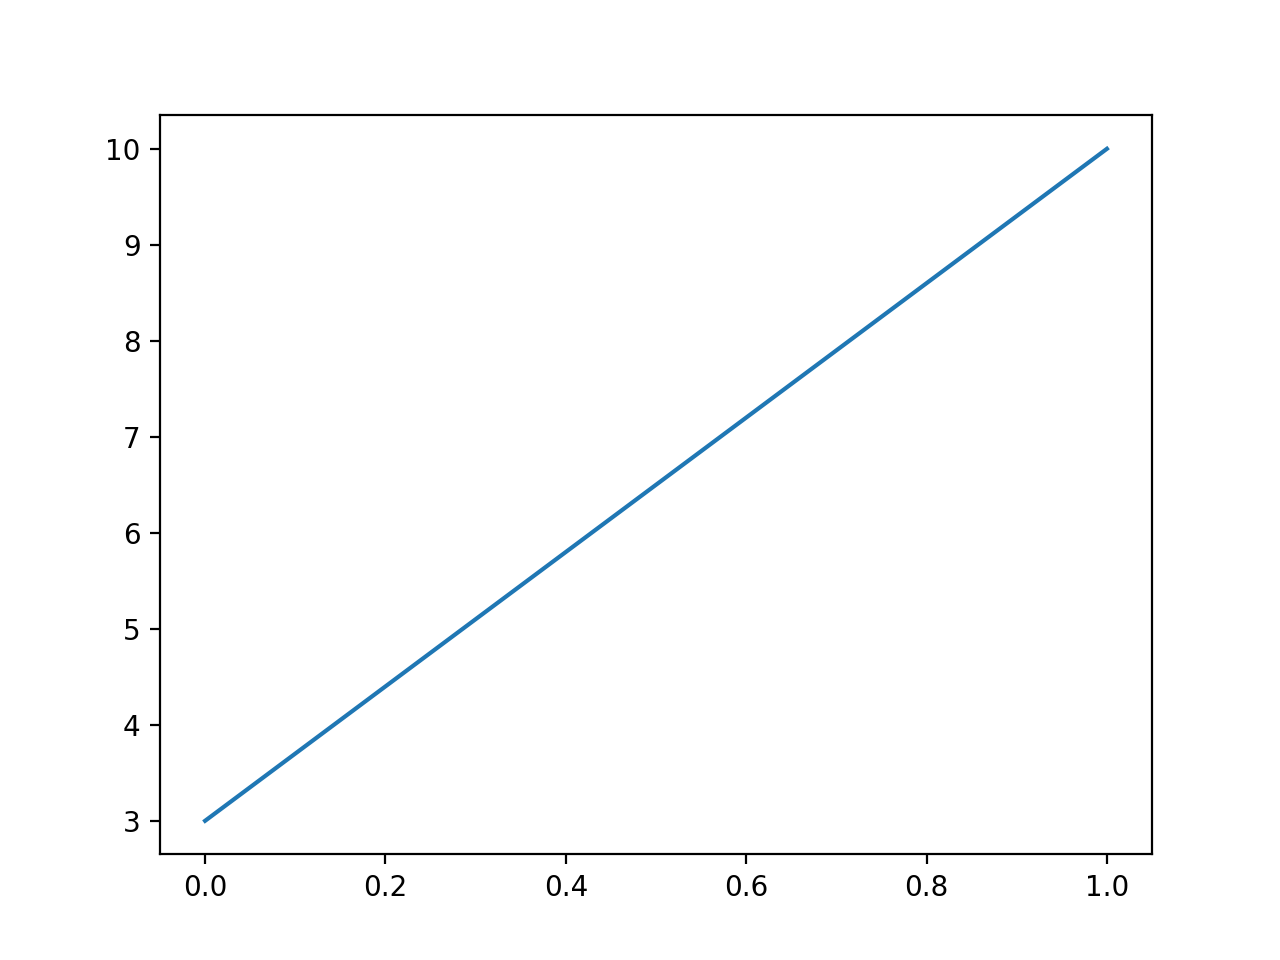
如果我们要绘制坐标 (1, 3) 到 (8, 10) 的线,我们就需要传递两个数组 [1, 8] 和 [3, 10] 给 plot 函数:
实例
import numpy as np
xpoints = np. array ( [ 1 , 8 ] )
ypoints = np. array ( [ 3 , 10 ] )
plt. plot ( xpoints , ypoints )
plt. show ( )
以上代码输出结果为:
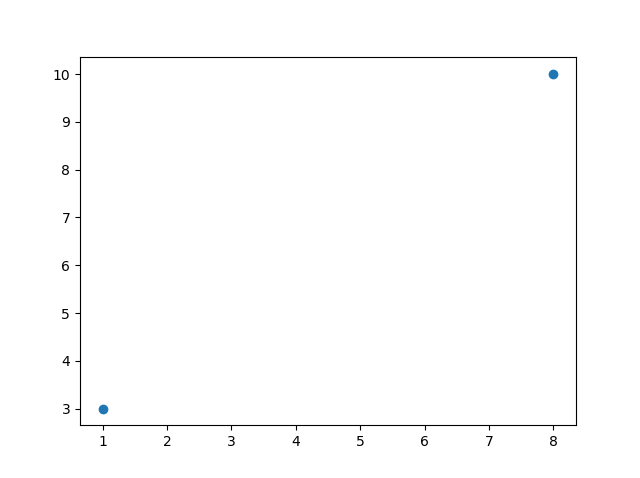
如果我们只想绘制两个坐标点,而不是一条线,可以使用 o 参数,表示一个实心圈的标记:
绘制坐标 (1, 3) 和 (8, 10) 的两个点
import numpy as np
xpoints = np. array ( [ 1 , 8 ] )
ypoints = np. array ( [ 3 , 10 ] )
plt. plot ( xpoints , ypoints , 'o' )
plt. show ( )
以上代码输出结果为:
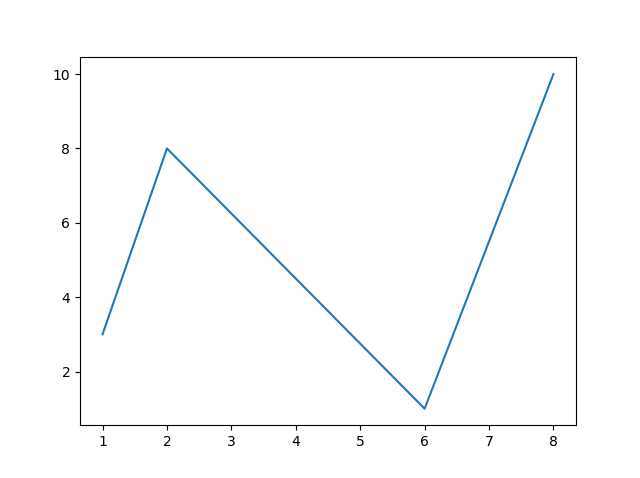
我们也可以绘制任意数量的点,只需确保两个轴上的点数相同即可。
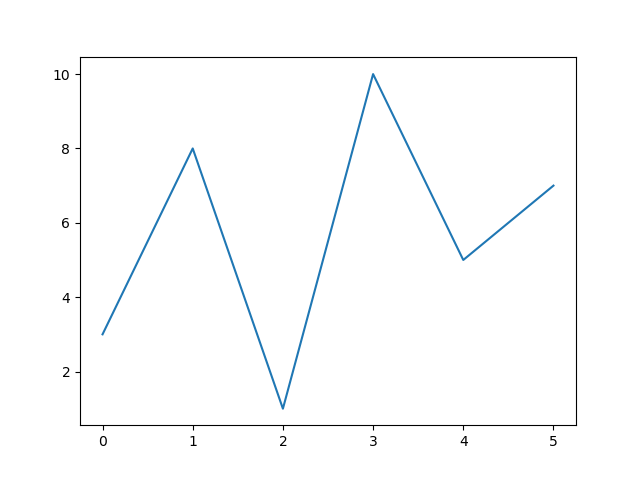
绘制一条不规则线,坐标为 (1, 3) 、 (2, 8) 、(6, 1) 、(8, 10),对应的两个数组为:[1, 2, 6, 8] 与 [3, 8, 1, 10]。
实例
import numpy as np
xpoints = np. array ( [ 1 , 2 , 6 , 8 ] )
ypoints = np. array ( [ 3 , 8 , 1 , 10 ] )
plt. plot ( xpoints , ypoints )
plt. show ( )
以上代码输出结果为:
如果我们不指定 x 轴上的点,则 x 会根据 y 的值来设置为 0, 1, 2, 3..N-1 。
实例
import numpy as np
ypoints = np. array ( [ 3 , 10 ] )
plt. plot ( ypoints )
plt. show ( )
以上代码输出结果为:
从上图可以看出 x 的值默认设置为 [0, 1] 。
再看一个有更多值的实例:
实例
import numpy as np
ypoints = np. array ( [ 3 , 8 , 1 , 10 , 5 , 7 ] )
plt. plot ( ypoints )
plt. show ( )
以上代码输出结果为:
从上图可以看出 x 的值默认设置为 [0, 1, 2, 3, 4, 5] 。
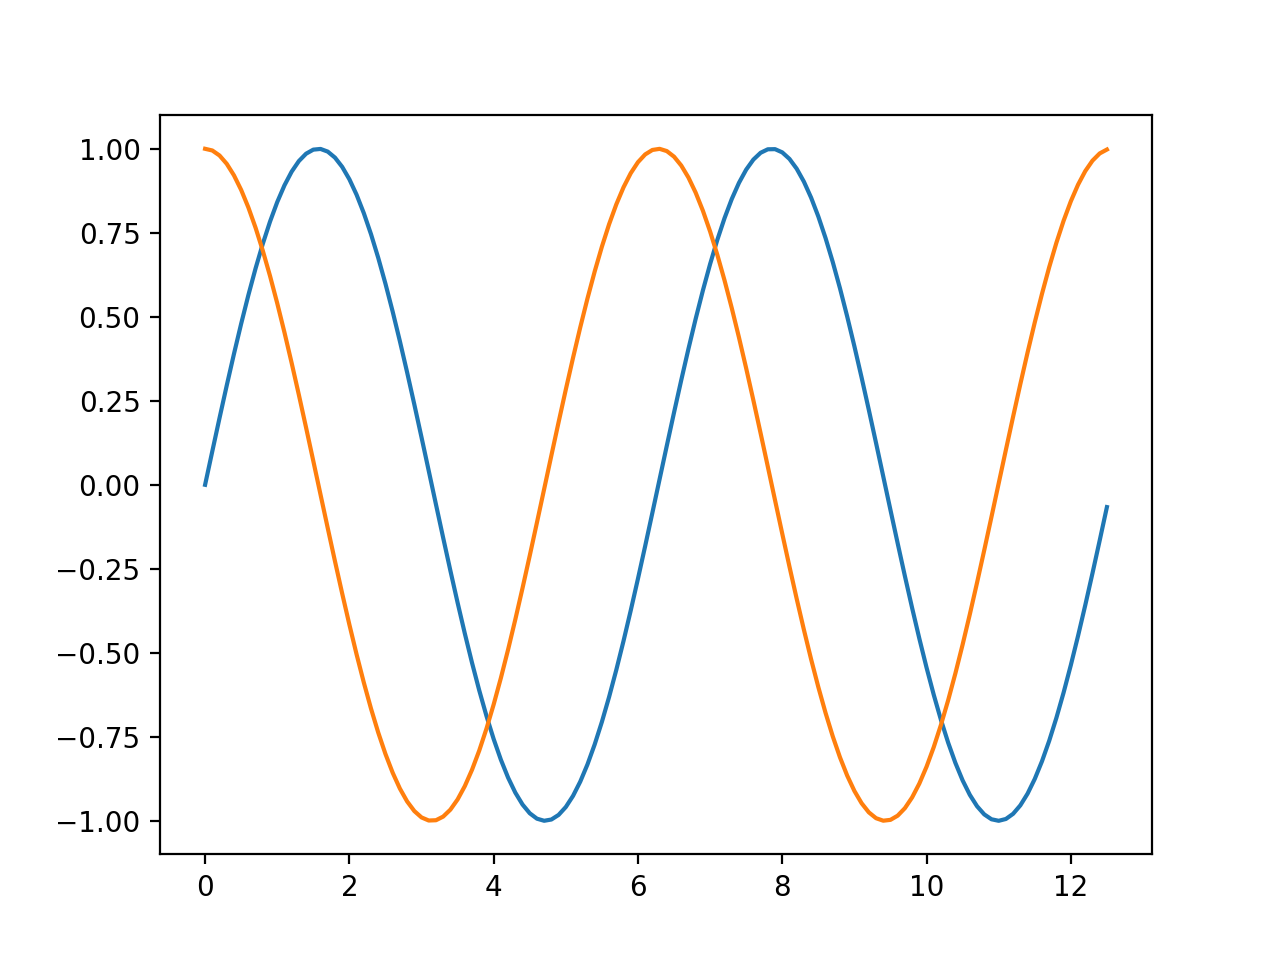
以下实例我们绘制一个正弦和余弦图,在 plt.plot() 参数中包含两对 x,y 值,第一对是 x,y ,这对应于正弦函数,第二对是 x,z ,这对应于余弦函数。
实例
import numpy as np
x = np. arange ( , 4 *np. pi , 0.1 ) # start,stop,step
y = np. sin ( x )
z = np. cos ( x )
plt. plot ( x , y , x , z )
plt. show ( )
以上代码输出结果为:
更多内容参考: https://matplotlib.org/stable/api/_as_gen/matplotlib.pyplot.plot.html