Matplotlib 绘制多图
我们可以使用 pyplot 中的 subplot() 和 subplots() 方法来绘制多个子图。
subplot() 方法在绘图时需要指定位置, subplots() 方法可以一次生成多个,在调用时只需要调用生成对象的 ax 即可。
subplot
									subplot(nrows, ncols, index, **kwargs)
subplot(pos, **kwargs)
subplot(**kwargs)
subplot(ax)
以上函数将整个绘图区域分成 nrows 行和 ncols 列,然后从左到右,从上到下的顺序对每个子区域进行编号 1...N ,左上的子区域的编号为 1、右下的区域编号为 N,编号可以通过参数 index 来设置。
设置 numRows = 1,numCols = 2,就是将图表绘制成 1x2 的图片区域, 对应的坐标为:
(1, 1), (1, 2)
plotNum = 1 , 表示的坐标为(1, 1), 即第一行第一列的子图。
plotNum = 2 , 表示的坐标为(1, 2), 即第一行第二列的子图。
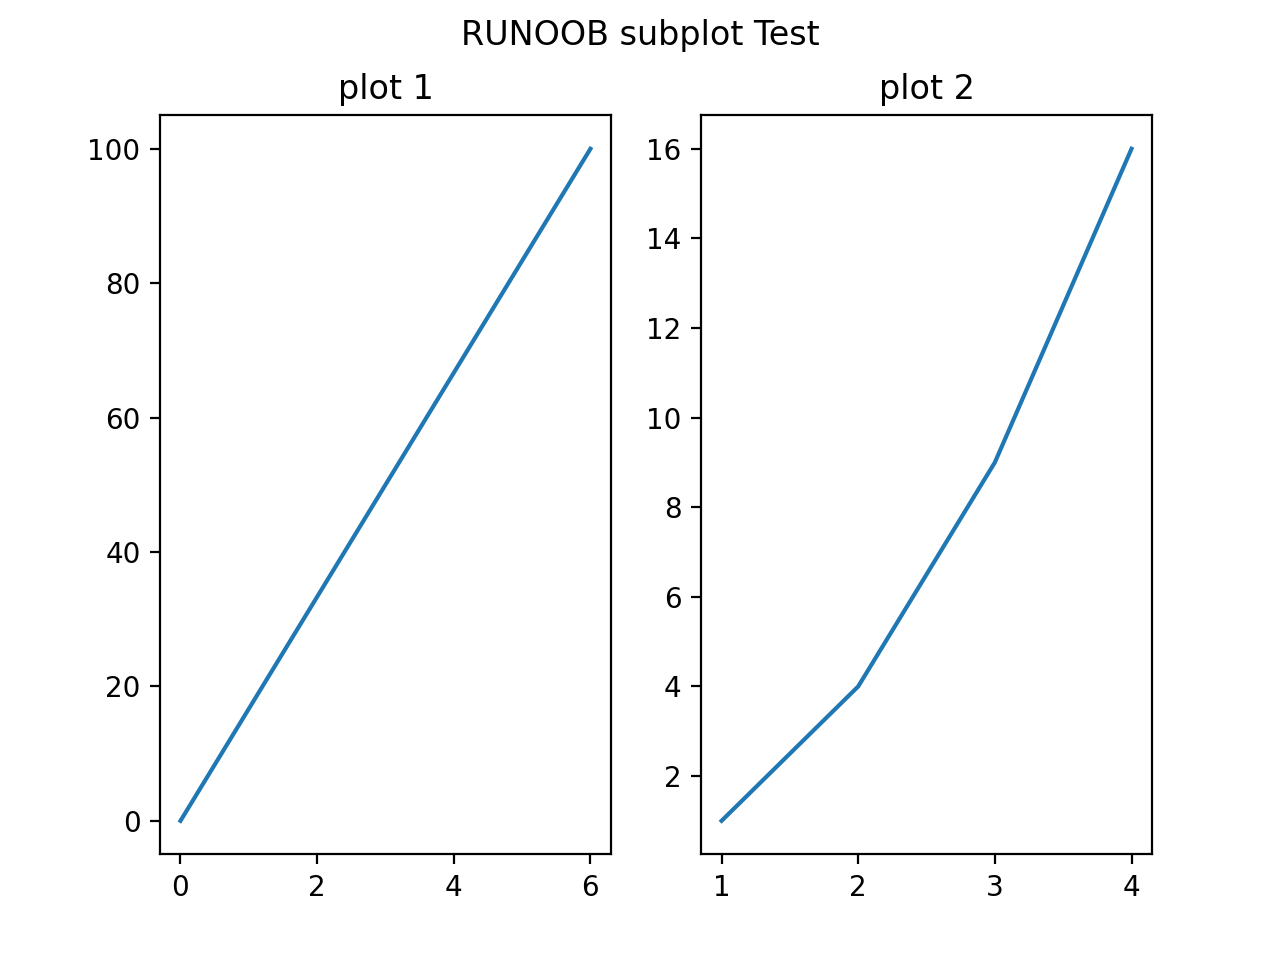
实例
import numpy as np
#plot 1:
xpoints = np. array ( [ , 6 ] )
ypoints = np. array ( [ , 100 ] )
plt. subplot ( 1 , 2 , 1 )
plt. plot ( xpoints , ypoints )
plt. title ( "plot 1" )
#plot 2:
x = np. array ( [ 1 , 2 , 3 , 4 ] )
y = np. array ( [ 1 , 4 , 9 , 16 ] )
plt. subplot ( 1 , 2 , 2 )
plt. plot ( x , y )
plt. title ( "plot 2" )
plt. suptitle ( "yssmx subplot Test" )
plt. show ( )
显示结果如下:
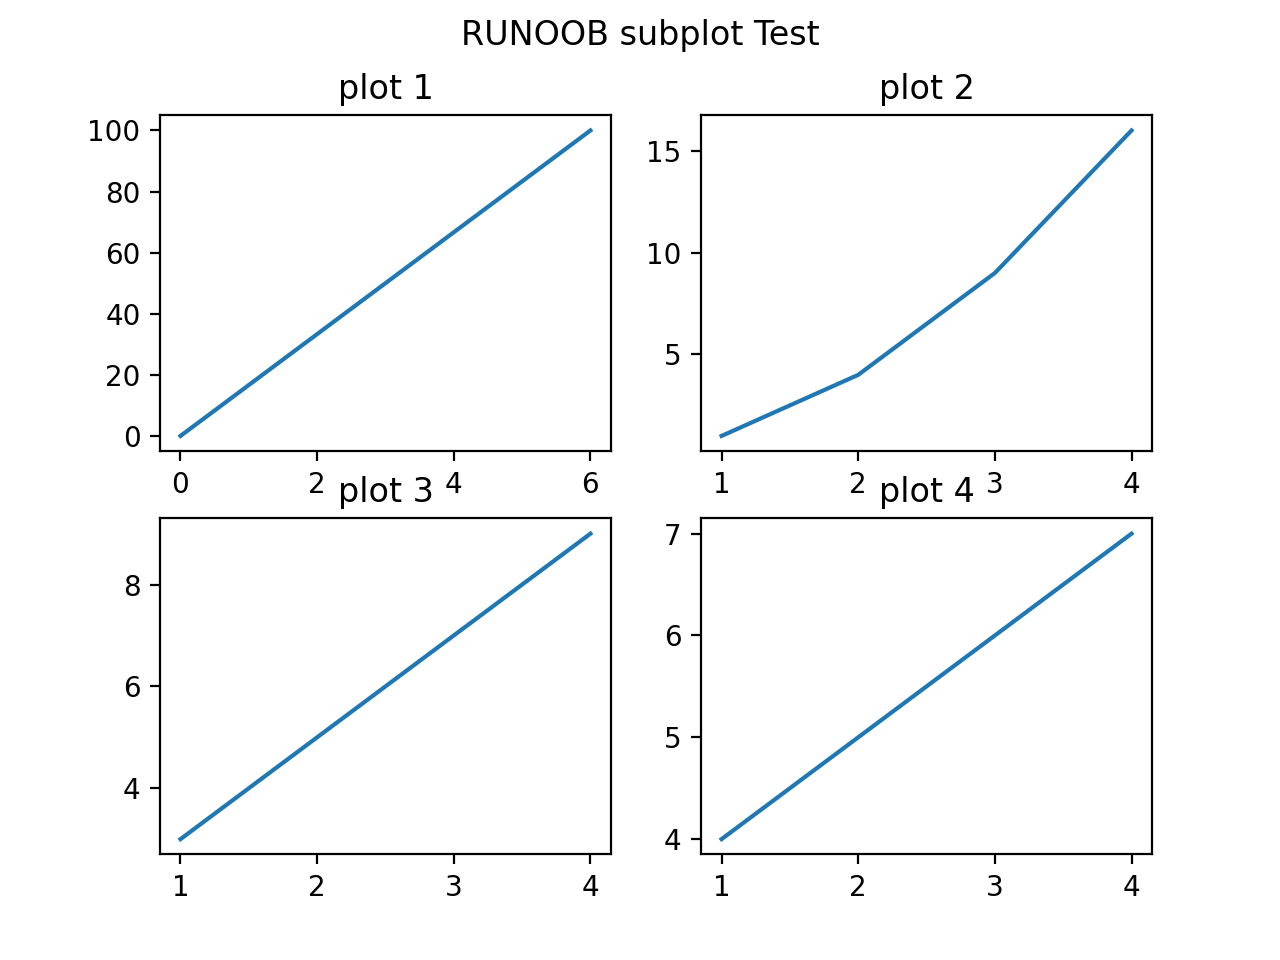
设置 numRows = 2,numCols = 2,就是将图表绘制成 2x2 的图片区域, 对应的坐标为:
										(1, 1), (1, 2)
(2, 1), (2, 2)
plotNum = 1 , 表示的坐标为(1, 1), 即第一行第一列的子图。
plotNum = 2 , 表示的坐标为(1, 2), 即第一行第二列的子图。
plotNum = 3 , 表示的坐标为(2, 1), 即第二行第一列的子图。
plotNum = 4 , 表示的坐标为(2, 2), 即第二行第二列的子图。
实例
import numpy as np
#plot 1:
x = np. array ( [ , 6 ] )
y = np. array ( [ , 100 ] )
plt. subplot ( 2 , 2 , 1 )
plt. plot ( x , y )
plt. title ( "plot 1" )
#plot 2:
x = np. array ( [ 1 , 2 , 3 , 4 ] )
y = np. array ( [ 1 , 4 , 9 , 16 ] )
plt. subplot ( 2 , 2 , 2 )
plt. plot ( x , y )
plt. title ( "plot 2" )
#plot 3:
x = np. array ( [ 1 , 2 , 3 , 4 ] )
y = np. array ( [ 3 , 5 , 7 , 9 ] )
plt. subplot ( 2 , 2 , 3 )
plt. plot ( x , y )
plt. title ( "plot 3" )
#plot 4:
x = np. array ( [ 1 , 2 , 3 , 4 ] )
y = np. array ( [ 4 , 5 , 6 , 7 ] )
plt. subplot ( 2 , 2 , 4 )
plt. plot ( x , y )
plt. title ( "plot 4" )
plt. suptitle ( "yssmx subplot Test" )
plt. show ( )
显示结果如下:
subplots()
subplots() 方法语法格式如下:
matplotlib.pyplot.subplots(nrows=1, ncols=1, *, sharex=False, sharey=False, squeeze=True, subplot_kw=None, gridspec_kw=None, **fig_kw)参数说明:
- nrows :默认为 1,设置图表的行数。
- ncols :默认为 1,设置图表的列数。
- sharex、sharey :设置 x、y 轴是否共享属性,默认为 false,可设置为 'none'、'all'、'row' 或 'col'。 False 或 none 每个子图的 x 轴或 y 轴都是独立的,True 或 'all':所有子图共享 x 轴或 y 轴,'row' 设置每个子图行共享一个 x 轴或 y 轴,'col':设置每个子图列共享一个 x 轴或 y 轴。
- squeeze :布尔值,默认为 True,表示额外的维度从返回的 Axes(轴)对象中挤出,对于 N*1 或 1*N 个子图,返回一个 1 维数组,对于 N*M,N>1 和 M>1 返回一个 2 维数组。如果设置为 False,则不进行挤压操作,返回一个元素为 Axes 实例的2维数组,即使它最终是1x1。
- subplot_kw :可选,字典类型。把字典的关键字传递给 add_subplot() 来创建每个子图。
- gridspec_kw :可选,字典类型。把字典的关键字传递给 GridSpec 构造函数创建子图放在网格里(grid)。
- **fig_kw :把详细的关键字参数传给 figure() 函数。
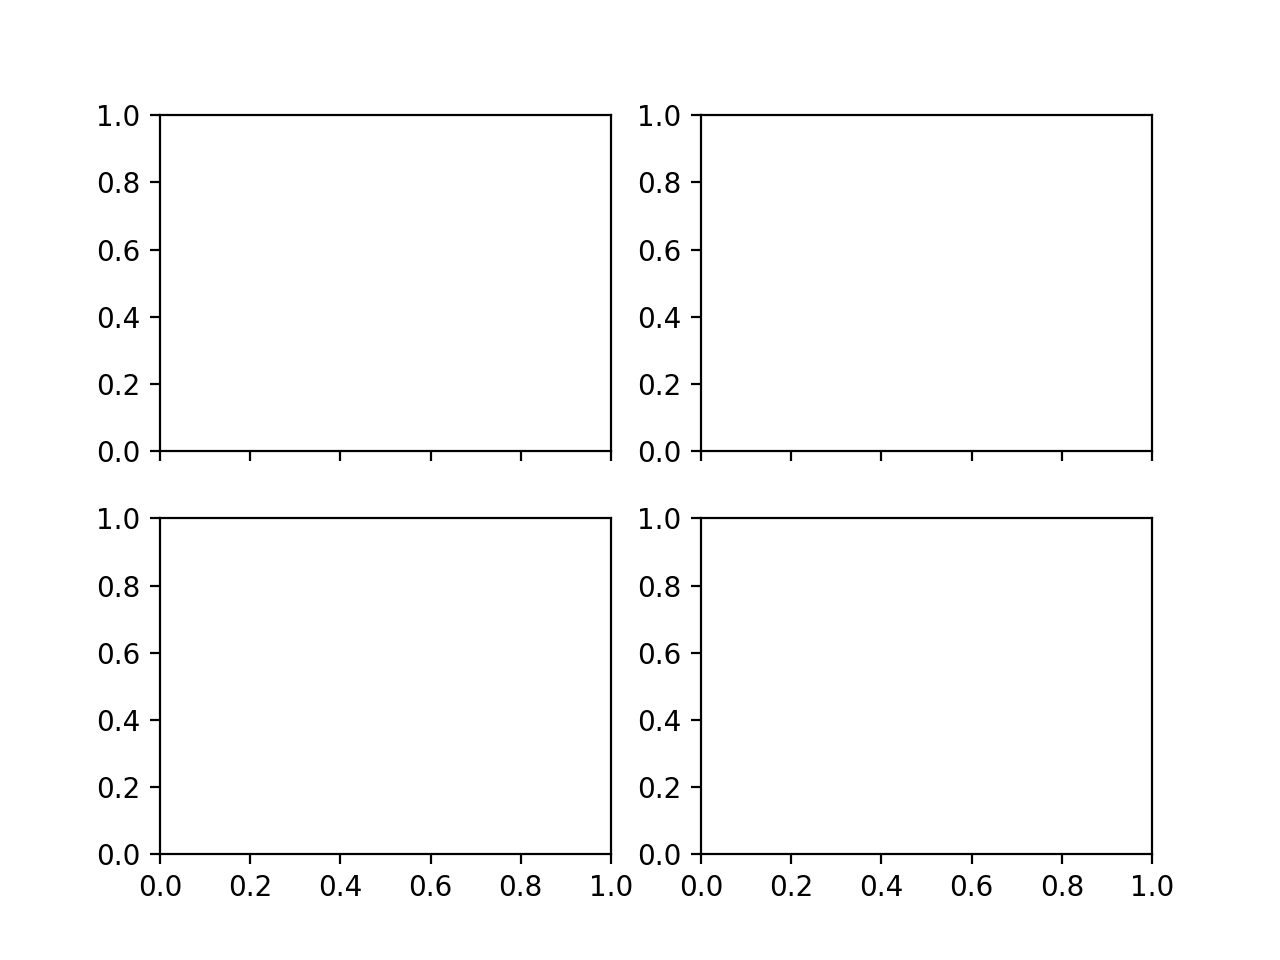
实例
import numpy as np
# 创建一些测试数据 -- 图1
x = np. linspace ( , 2 *np. pi , 400 )
y = np. sin ( x** 2 )
# 创建一个画像和子图 -- 图2
fig , ax = plt. subplots ( )
ax. plot ( x , y )
ax. set_title ( 'Simple plot' )
# 创建两个子图 -- 图3
f , ( ax1 , ax2 ) = plt. subplots ( 1 , 2 , sharey = True )
ax1. plot ( x , y )
ax1. set_title ( 'Sharing Y axis' )
ax2. scatter ( x , y )
# 创建四个子图 -- 图4
fig , axs = plt. subplots ( 2 , 2 , subplot_kw = dict ( projection = "polar" ) )
axs [ , ] . plot ( x , y )
axs [ 1 , 1 ] . scatter ( x , y )
# 共享 x 轴
plt. subplots ( 2 , 2 , sharex = 'col' )
# 共享 y 轴
plt. subplots ( 2 , 2 , sharey = 'row' )
# 共享 x 轴和 y 轴
plt. subplots ( 2 , 2 , sharex = 'all' , sharey = 'all' )
# 这个也是共享 x 轴和 y 轴
plt. subplots ( 2 , 2 , sharex = True , sharey = True )
# 创建标识为 10 的图,已经存在的则删除
fig , ax = plt. subplots ( num = 10 , clear = True )
plt. show ( )
部分图表显示结果如下:
图1
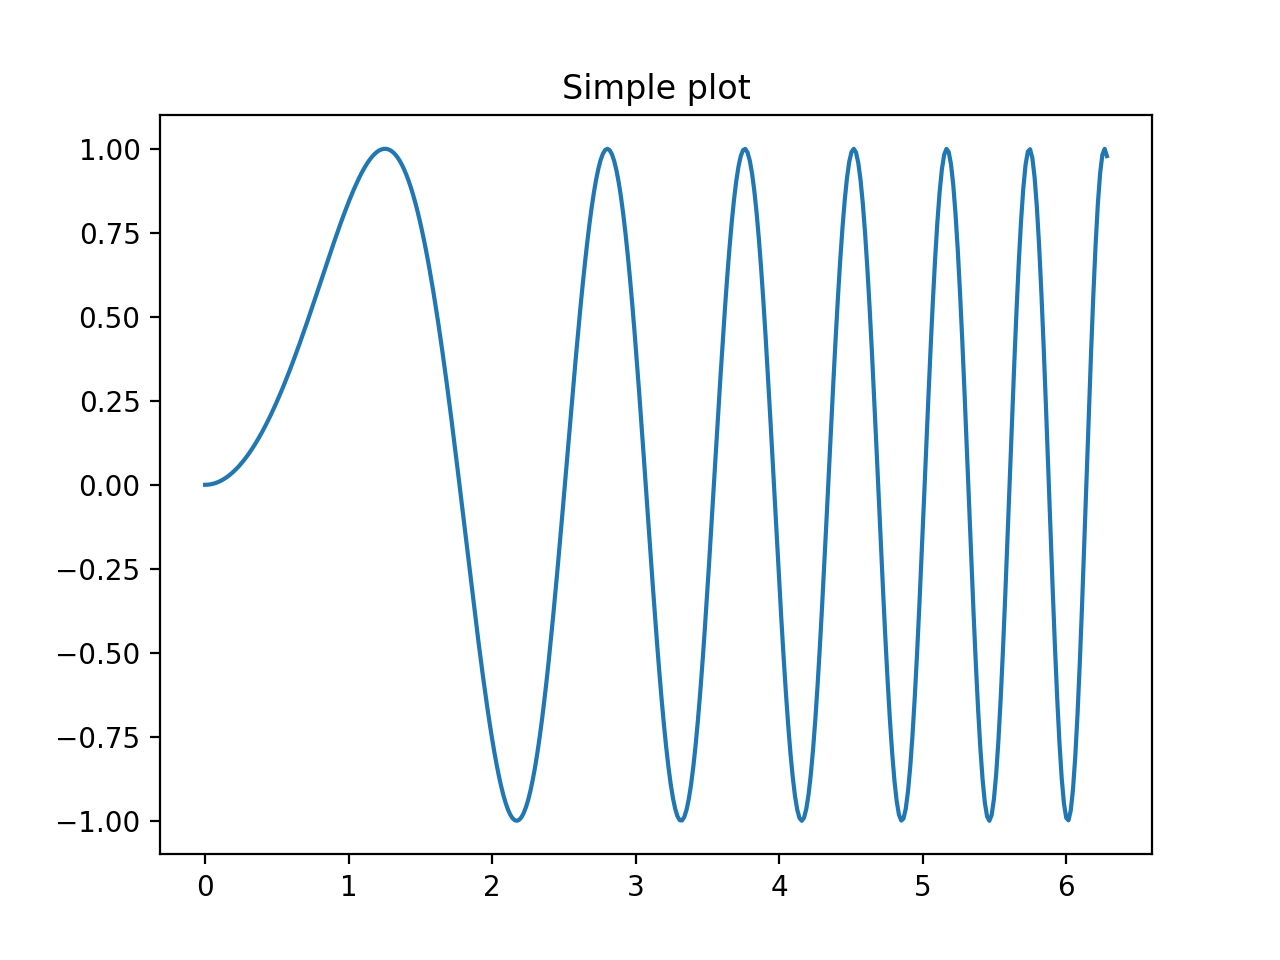
图2
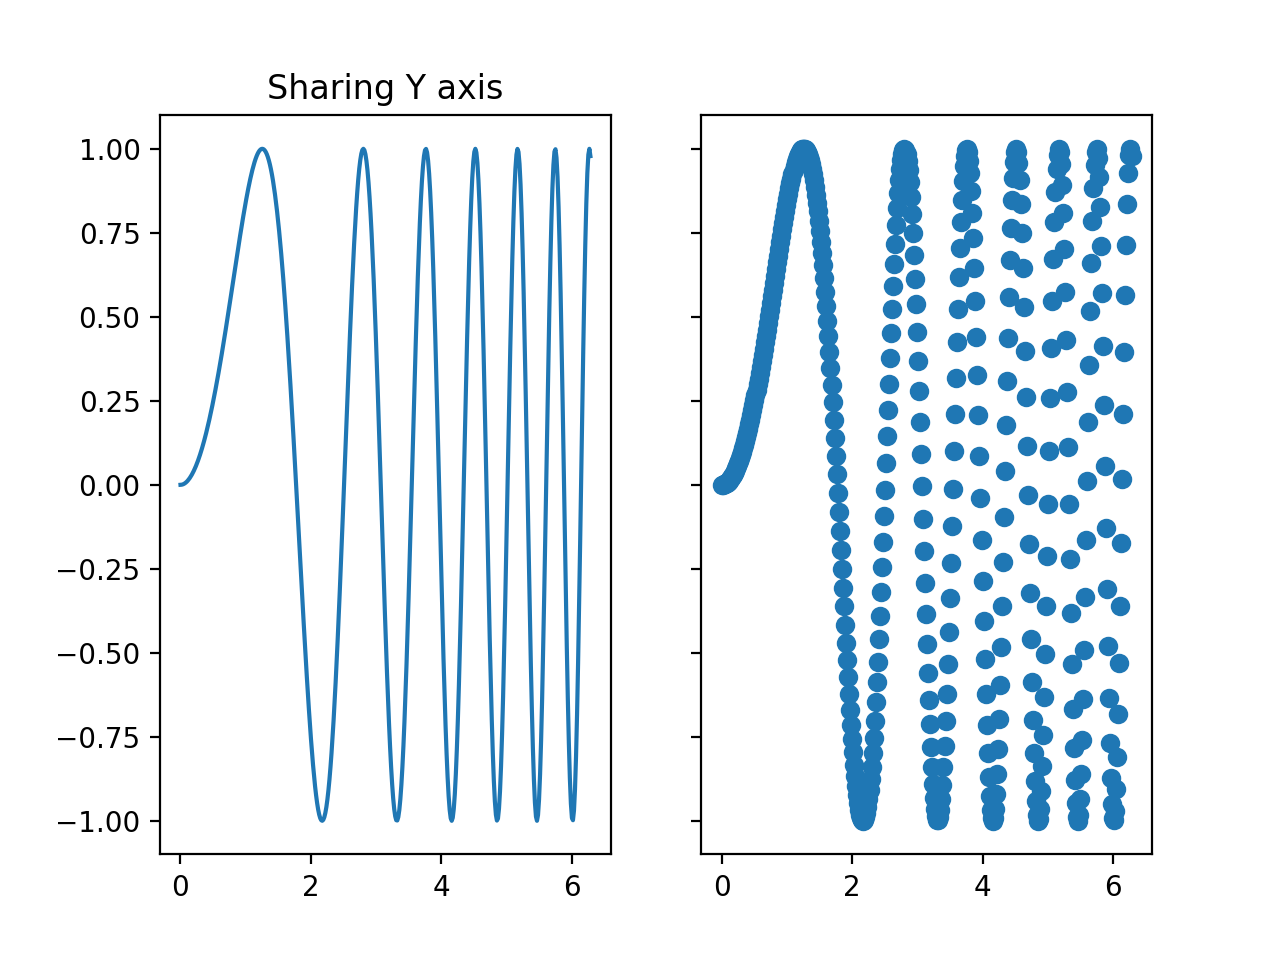
图3
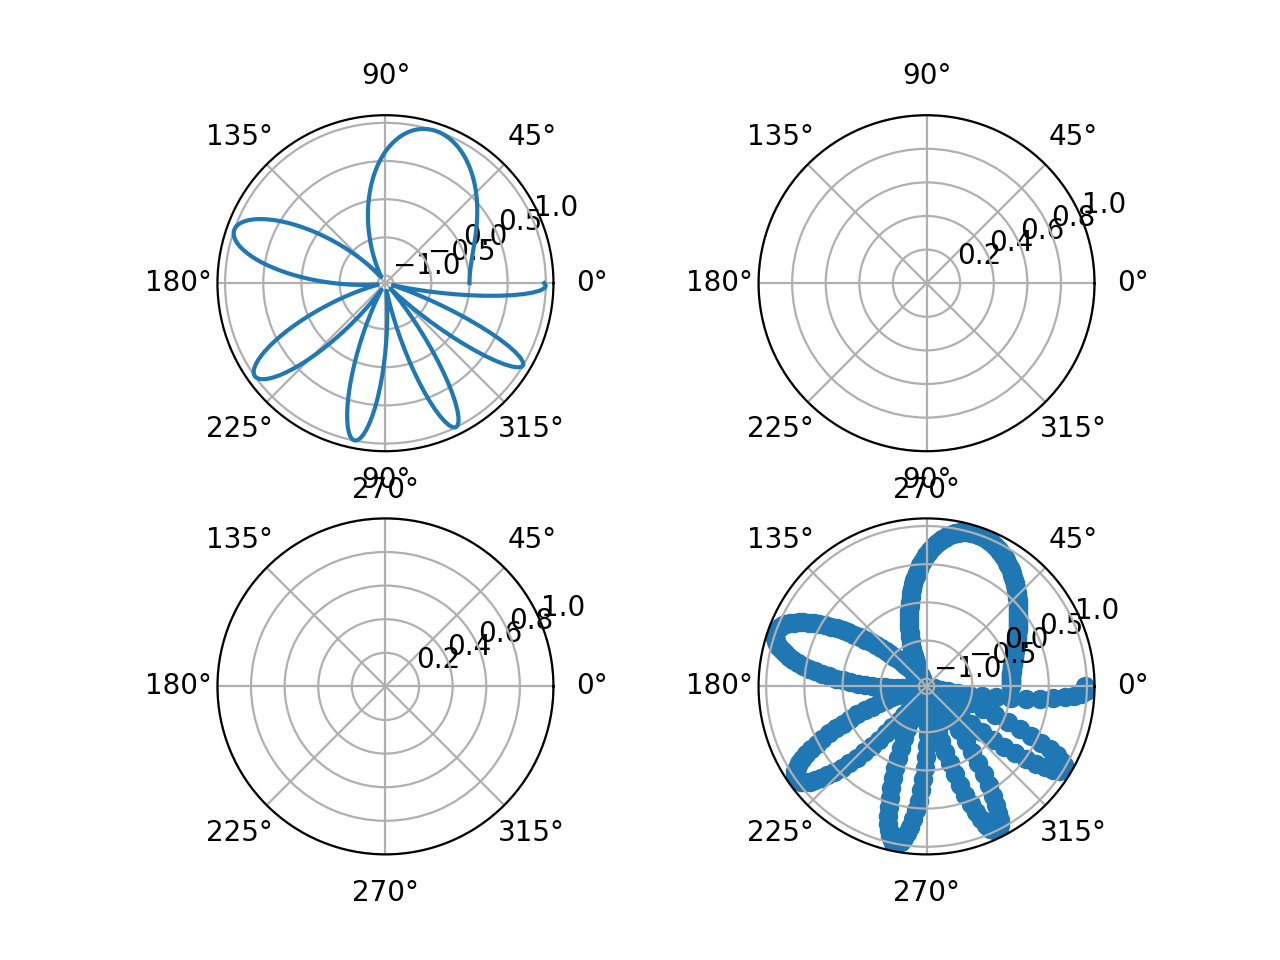
图4